
Reviewing Agricultural Trade Policies
To Promote Intra-OIC Agricultural Trade
134
4.4.2. Agricultural Trade Policies in Chad
Background
The agricultural sector in Chad has the primary aim of guarantee economic development and
food security, thus the country’s agricultural policy is to increase the production together with
its productivity, to provide a higher standard of living of its population.
The heavy taxation of imports and exports of agricultural goods has impeded the functioning of
food markets in Chad. However, cross-border trade and local cereal markets play a crucial role
in supplying areas in short supply and in reducing food insecurity.
Transport infrastructure is inadequate with many agricultural settlements being isolated. Those
two factors result in high cost of transporting food products. Trade is also hampered by
regulatory constraints, limiting the ability of producers to export their agricultural produce and
increase their earnings (WTO, 2007).
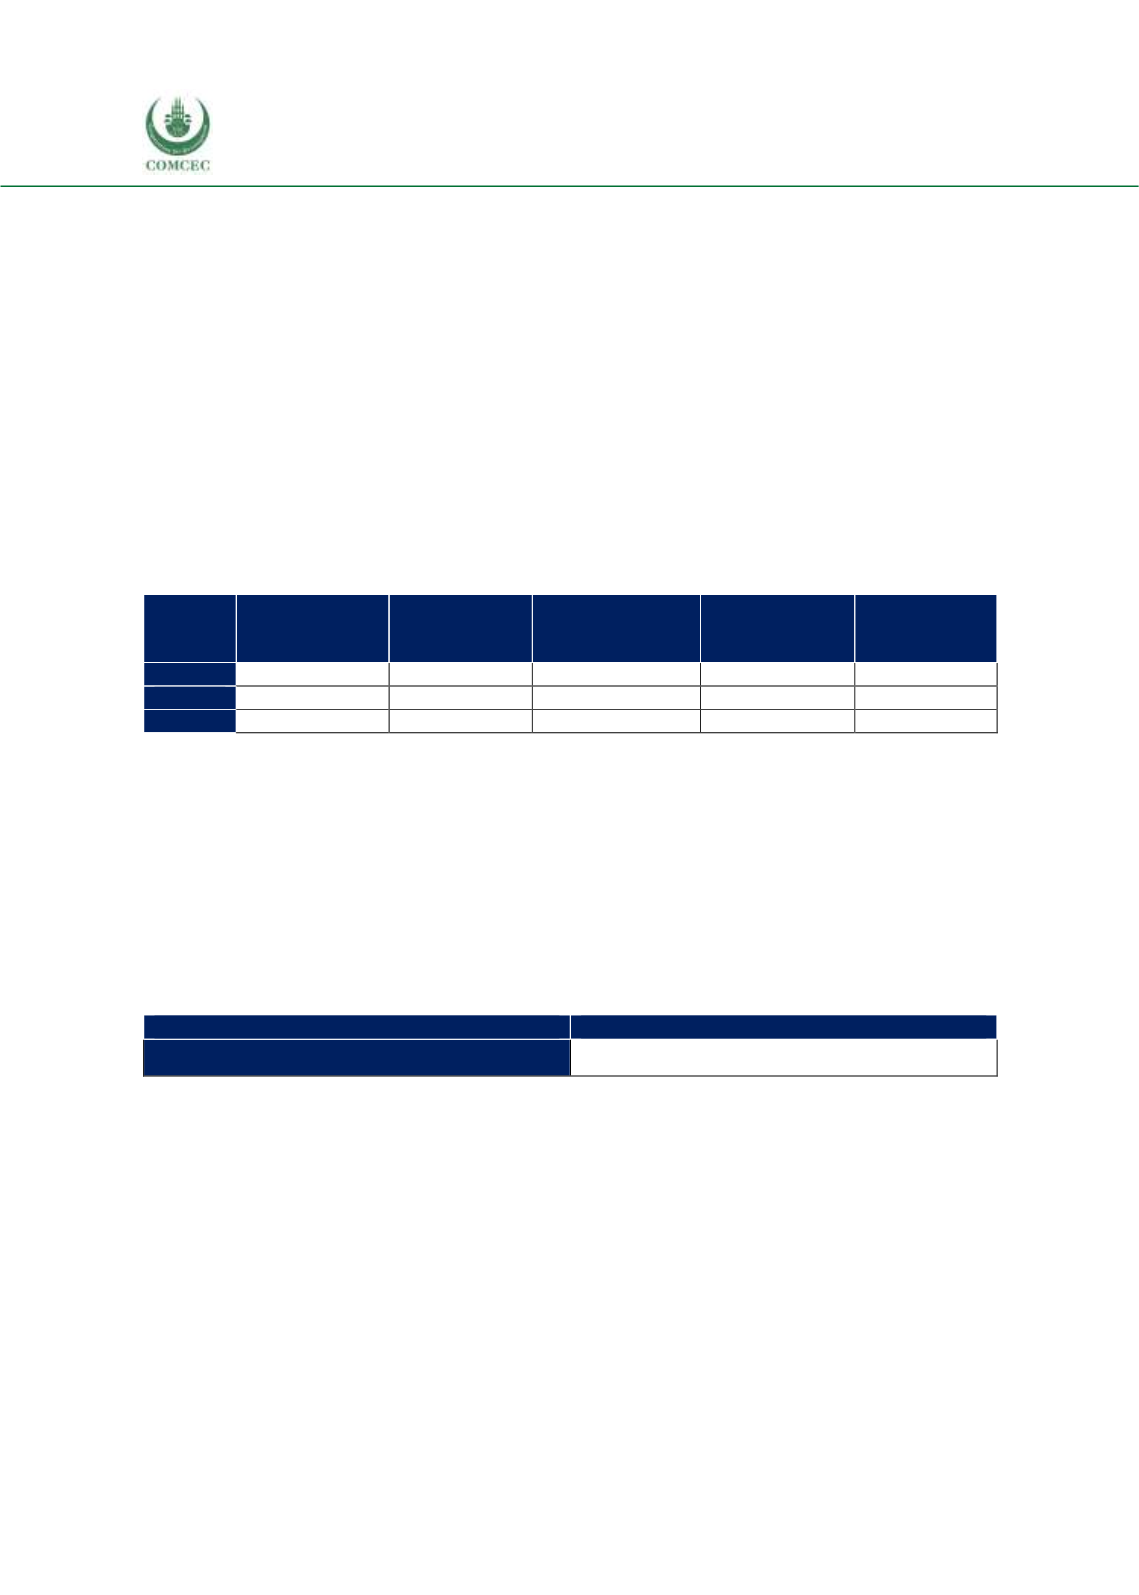
Table 4. 43 Tariffs Set by Chad for Top 5 Import Products from the OIC Exporters, %
11-12:
Beverages,
tobacco
04: Cereals
09:
Miscellaneous p.
05: Vegetables,
fruit
06: Sugars
2011
16.5
21.1
14.9
30.0
23.7
2015
10.5
7.6
2.9
14.7
3.7
2016
11.9
18.7
12.3
30.0
30.0
Source: ITC Macmap, CEPII BACI, Eurostat RAMON, UN Comtrade, UN Trade Statistics, and authors’
calculations
Note. Top 5 products are identified considering 3 year average between 2014 and 2016 and ad valorem
equivalent (%) rates are considered for applied tariff rates.
Actually the tariffs applied to Chad’s top five imported products from the OIC countries vary
between 11.9 percent (beverages and tobacco) and 30 percent (vegetables, fruit and sugar)
(Table 4.43). The only export good to OIC countries for which there is available data is oil-seeds
and is subject to 12.3 percent of import duty (Table 4.44). Table 4.45 gives the list of OIC
countries exporting to Chad under preferential tariffs but no detail data could be found at
product level.
Table 4. 44 Tariffs Set by OIC Countries for Chad’s Top 5 Export Products, %
22: Oil-seeds
2016
12.3
Source: ITC Macmap, CEPII BACI, Eurostat RAMON, UN Comtrade, UN Trade Statistics, and authors’
calculations


