


 145 / 272

Reviewing Agricultural Trade Policies
To Promote Intra-OIC Agricultural Trade
133
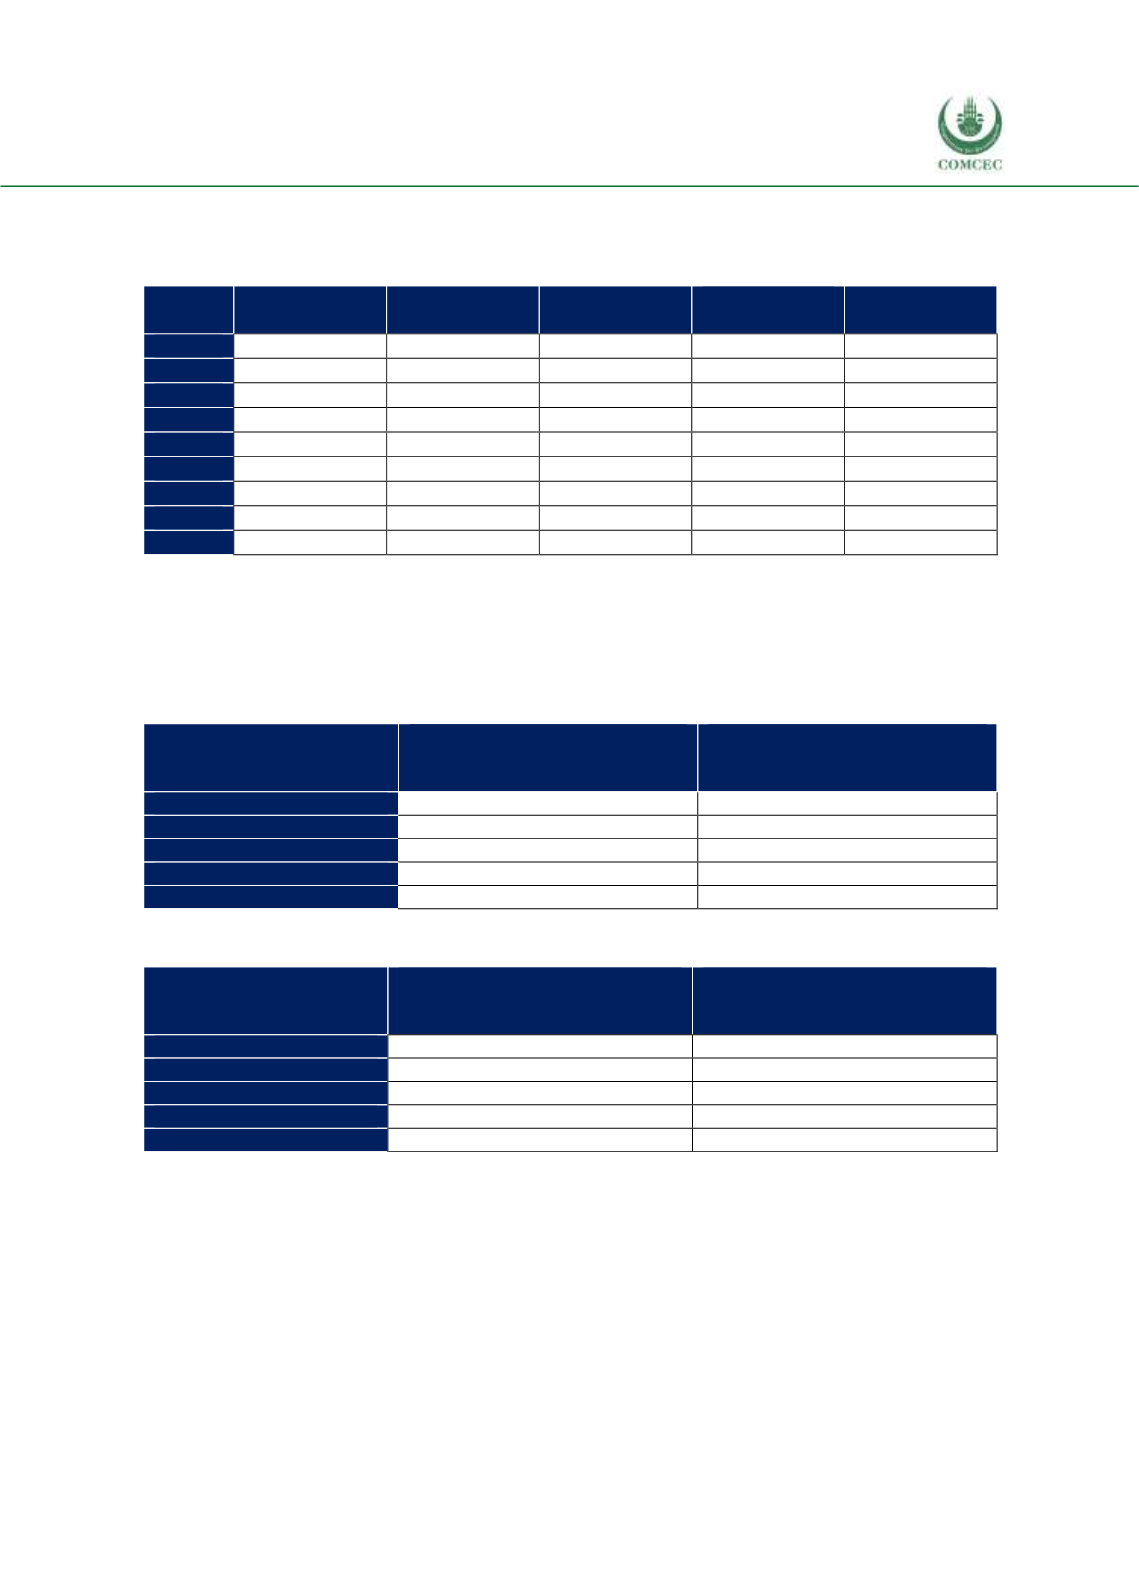
share of non-OIC countries’ share is 67.3%, the share of the Arab group is 23.1%, and the share
of the Asian group is 9.6%. The 2016 data of the African group is not available.
Table 4. 40 Distribution of Chad’s Top 5 Import Products, by Origin, %
African group
Asian group
Arab group
Non-OIC
Countries
Total
2008
100.0
100
2009
10.0
1.9
88.1
100
2010
71.6
28.4
100
2011
25.0
75.0
100
2012
93.6
6.4
100
2013
41.6
58.4
100
2014
23.9
76.1
100
2015
5.2
5.5
89.3
100
2016
9.6
23.1
67.3
100
Source: CEPII BACI, Eurostat RAMON, UN Comtrade, UN Trade Statistics, and authors’ calculations
Table 4.41 shows that Turkey is the largest importer of Chad’s top five agricultural products in
the OIC market. The share of Turkey in the last available three-year average is 77.6%. Indonesia
is the second largest market for the top five agricultural products of Chad with a share of 10.4%.
The third largest market is Nigeria, followed by Bahrain and Egypt.
Table 4. 41 Top 5 OIC Destination Countries for Chad’s Top 5 Export Products
Importer OIC country
Value of agricultural exports to
the country, million USD, last 3-
year average
% share in total agricultural
exports to the OIC countries,
last 3-year average
Turkey
19.7
77.6
Indonesia
2.6
10.4
Nigeria
1.3
5.2
Bahrain
0.9
3.6
Egypt
0.3
1.2
Source: CEPII BACI, Eurostat RAMON, UN Comtrade, UN Trade Statistics, and authors’ calculations
Table 4. 42 Top 5 OIC Origin Countries of Chad’s Top 5 Import Products
Exporter OIC country
Value of agricultural imports
from the country, million USD,
last 3-year average
% share in total agricultural
imports from the OIC countries,
last 3-year average
Cameroon
14.6
39.4
Senegal
9.9
26.7
Turkey
7.9
21.3
Egypt
3.0
8.2
UAE
0.5
1.4
Source: CEPII BACI, Eurostat RAMON, UN Comtrade, UN Trade Statistics, and authors’ calculations
Table 4.42 shows the first five markets that Chad purchases the top five import products.
Cameroon is the largest market for Chad’s top five agricultural product imports from the OIC
countries with a share of 39.4%, followed by Senegal with a share of 26.7%. Turkey is the third
largest market with a share of 21.3%, followed by Egypt and the United Arab Emirates.