


 144 / 272

Reviewing Agricultural Trade Policies
To Promote Intra-OIC Agricultural Trade
132
Top 5 Agricultural export and import products of Chad in the OIC Markets
According to the latest available three-year averages (2014-2016), the products that have the
top five shares in Chad’s total agricultural exports to the OIC countries are (top 5 agricultural
export products to the OIC):
22: Oil-seeds
263: Cotton
08: Feeding stuff for animals
21: Hides, skins
00: Live animals
with percentage shares of 83.4%, 14.9%, 1.0%, 0.5%, and 0.1%, respectively.
With regards to Chad’s top agricultural imports from the OIC countries, according to the latest
available three year averages (2014-2016), the products that have the top five shares in Chad’s
total agricultural imports from the OIC countries are (top 5 agricultural import products to the
OIC):
11-12: Beverages, tobacco
04: Cereals
09: Miscellaneous p.
05: Vegetables, fruit
06: Sugars
with percentage shares of 29.6%, 25.0%, 21.3%, 10.1%, and 5.6%, respectively.
The products in the two lists are mutually exclusive. Chad does not commonly import the
commonly exported products from OIC countries.
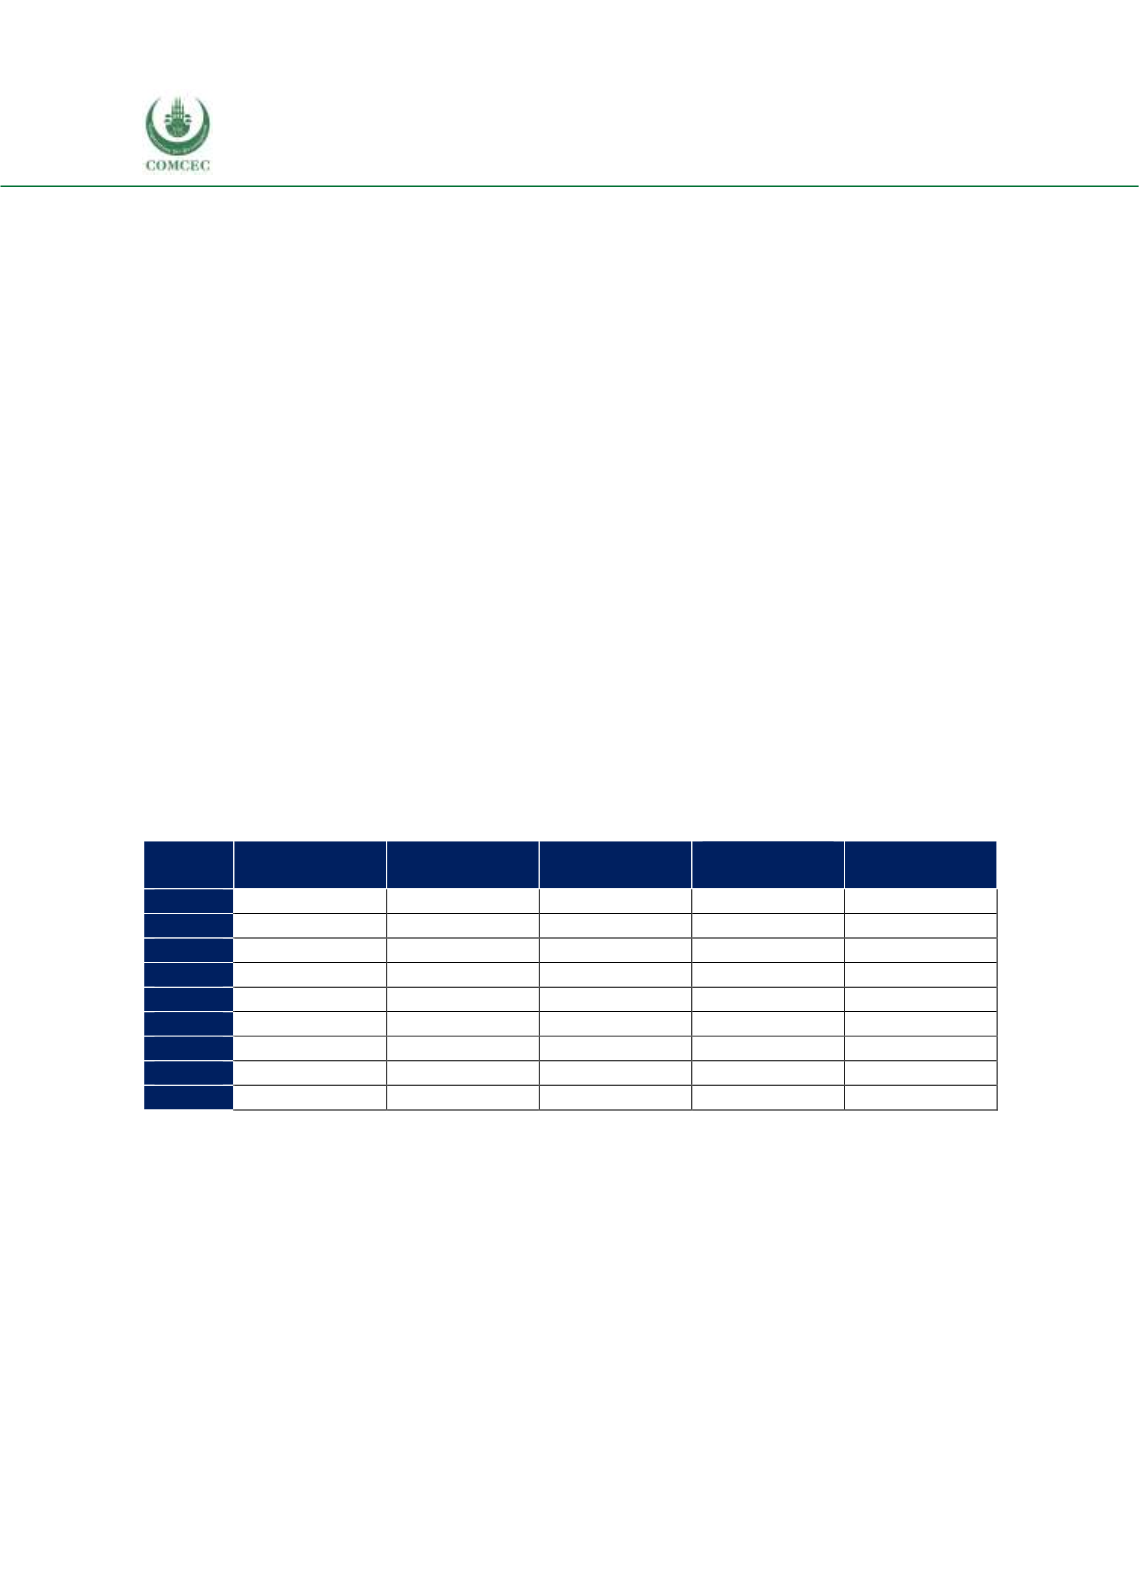
Table 4. 39 Distribution of Chad’s Top 5 Export Products, by Destination, %
African group
Asian group
Arab group
Non-OIC
Countries
Total
2008
2.0
98.0
100
2009
0.2
99.8
100
2010
0.7
9.2
1.0
89.1
100
2011
2.5
6.4
91.1
100
2012
0.1
27.1
5.6
67.2
100
2013
4.6
32.4
2.0
61.0
100
2014
6.0
40.9
1.9
51.2
100
2015
2.0
98.0
100
2016
0.2
99.8
100
Source: CEPII BACI, Eurostat RAMON, UN Comtrade, UN Trade Statistics, and authors’ calculations
Table 4.39 shows the distribution of the total export value of the top five export products of Chad
to the OIC countries according to destinations. With some data missing, non-OIC countries
constitute the most of Chad’s top five agricultural product exports. The Asian group’s share has
increased from 9.2 to 40.9 in the expense of non-OIC countries between 2010 and 2014, but
declined to 2% in 2015. The available data shows that the shares of the African and the Arab
groups have been small during the observation period, not exceeding 6%.
Table 4.40 shows the distribution of the top five agricultural products from the OIC countries
according to the region of origin. Non-OIC countries provide the majority of Chad’s import of the
top five agricultural products. The data shows that Chad’s imports have not been from a stable
source with country shares radically changing within the observation period. As of 2016, the