


 142 / 272

Reviewing Agricultural Trade Policies
To Promote Intra-OIC Agricultural Trade
130
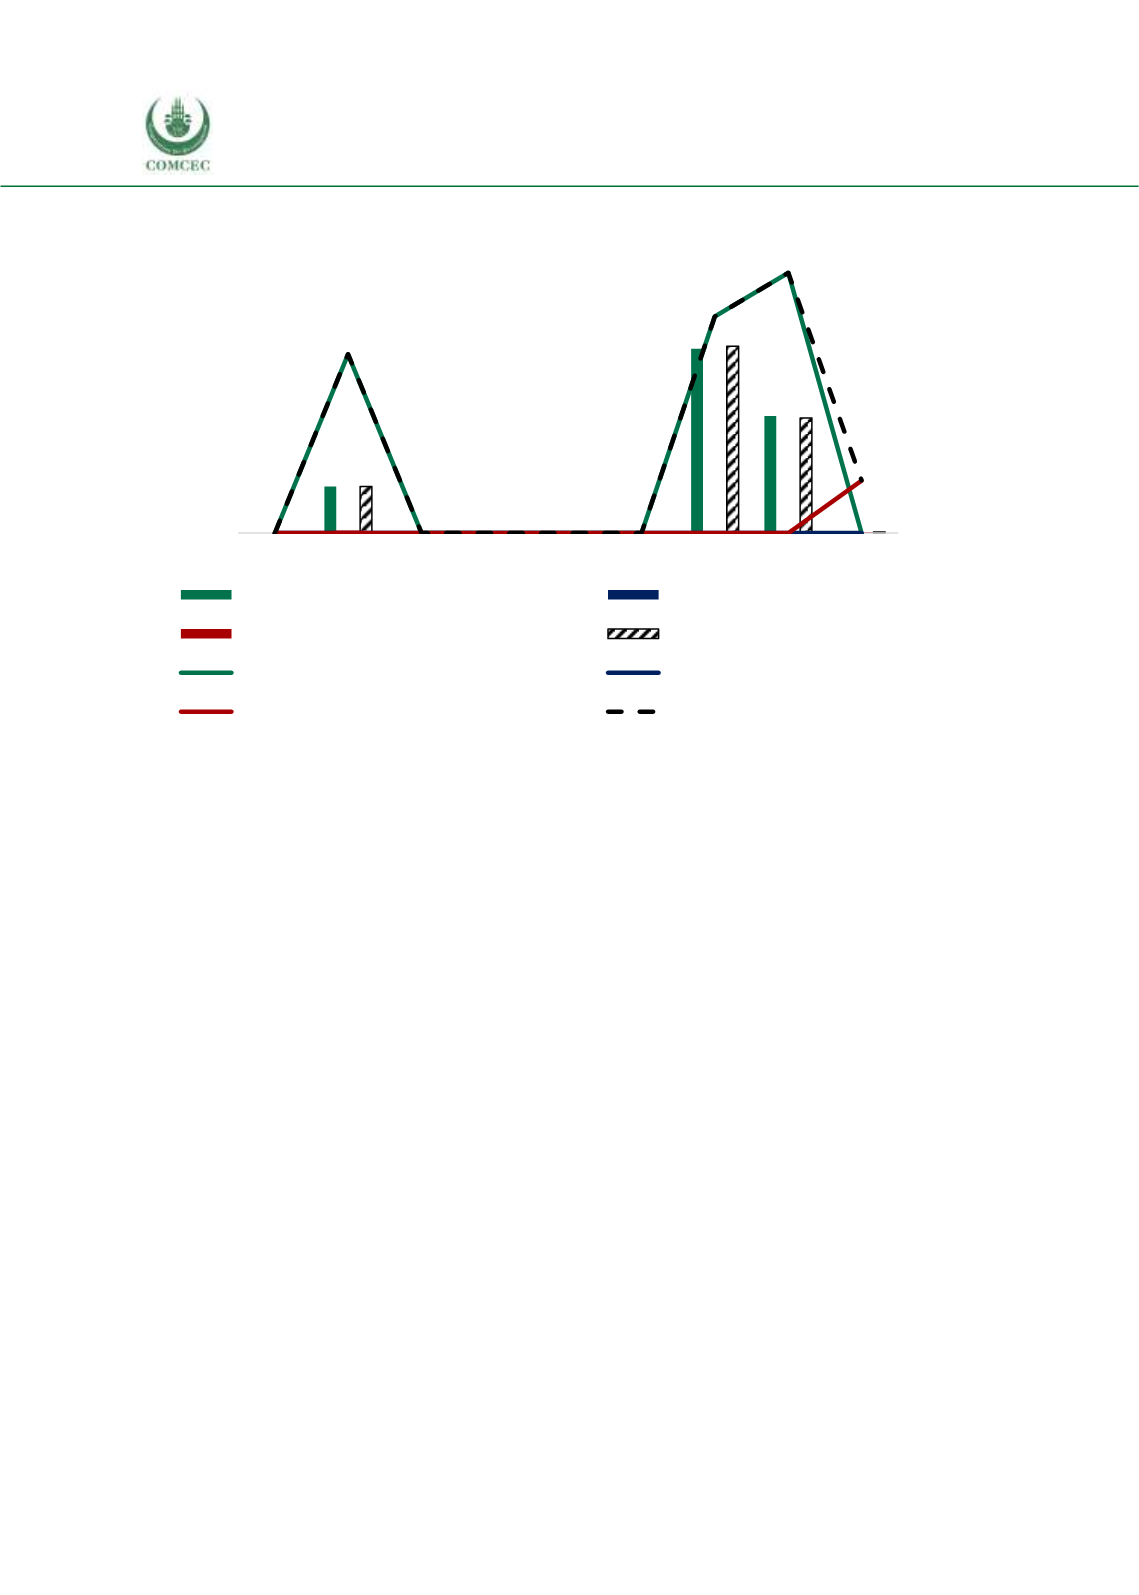
Figure 4. 46 Imports of Chad’s Agricultural Raw Materials from the OIC Groups
Source: CEPII BACI, Eurostat RAMON, UN Comtrade, UN Trade Statistics, and authors’ calculations
Figure 4.46 shows Chad’s agricultural raw material imports from the OIC countries. As of 2015,
imports the OIC countries constitute the majority of Chad’s agricultural raw material imports
with a share of 90.5%. The African group is a significant provider of agricultural raw materials
to Chad. The value of Chad’s agricultural rawmaterial imports from the Arab group is very small.
Figure 4.47 presents Chad’s fish product exports to the OIC countries. The fact that Chad is a
landlocked country explains the low values in fish export. With the data unavailable for most of
the observation period, Chad’s total fish product import of 4.8 million USD to the African group
in 2009 is probably a result of the decline in world trade due to the global crisis.
In summary;
Agri-food trade constitutes the majority of Chad’s agricultural imports and exports to
OIC countries.
The political instability in Chad’s neighboring African group countries in 2012 and
Chad’s poor economic performance in 2016 negatively affected Chad’s import from the
OIC group countries.
The Asian group has the highest share in Chad’s agri-food exports with a share of 96.3%
in 2016, followed by the African group and the Arab group with respective shares of
2.3% and 0.5%.
The African group had the highest share in Chad’s agri-food imports with a share of
29.9% in 2015, followed by the Asian group and the Arab group with respective shares
of 6.3%and 4.1%. However, the African group’s share fell behind that of the Asian group
with a sharp decline in 2016.
The Arab group has the highest share in Chad’s agricultural raw material exports with a
share of 9.7% in 2016, followed by the Asian group and the African group with
respective shares of 7.2% and 0.8%.
0
1
2
3
4
0
25
50
75
100
2008 2009 2010 2011 2012 2013 2014 2015 2016
African Group (million USD)
Asian Group (million USD)
Arab Group (million USD)
OIC Total (million USD)
African share in total agri-raw imp. (%)
Asian share in total agri-raw imp. (%)
Arab share in total agri-raw imp. (%)
OIC share in total agri-raw imp.
(%)
%
million USD