


 143 / 272

Reviewing Agricultural Trade Policies
To Promote Intra-OIC Agricultural Trade
131
The available data on Chad’s agricultural raw material imports is limited. However, the
African group had the highest share in Chad’s agricultural rawmaterial imports in 2015
with a share of 90.5%.
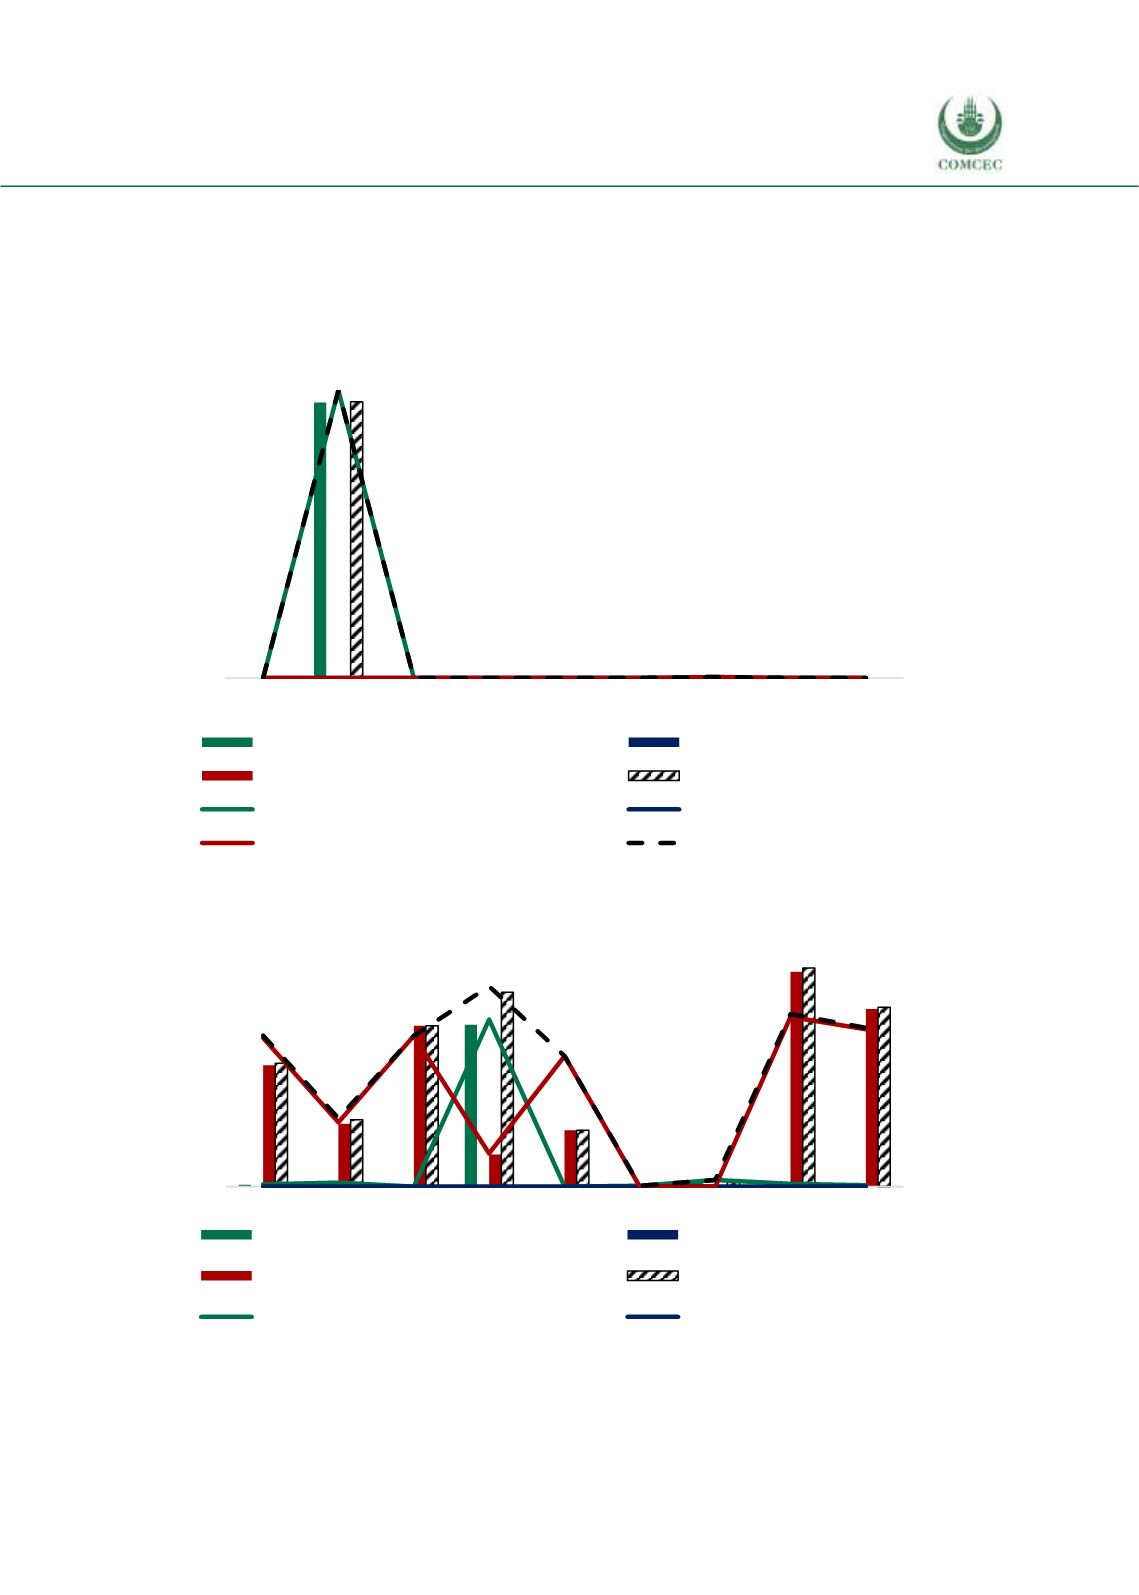
The Arab group has the highest share in Chad’s fish product imports with a share of 62.2 in 2016,
followed by the African group with a share of 0.6%.
Figure 4. 47 Exports of Chad’s Fish Products to the OIC Groups
Source: CEPII BACI, Eurostat RAMON, UN Comtrade, UN Trade Statistics, and authors’ calculations
Figure 4. 48 Imports of Chad’s Fish Products from the OIC Groups
Source: CEPII BACI, Eurostat RAMON, UN Comtrade, UN Trade Statistics, and authors’ calculations
0
1
2
3
4
5
0
20
40
60
80
100
2008 2009 2010 2011 2012 2013 2014 2015 2016
African Group (million USD)
Asian Group (million USD)
Arab Group (million USD)
OIC Total (million USD)
African share in total fish exp. (%)
Asian share in total fish exp. (%)
Arab share in total fish exp. (%)
OIC share in total fish exp. (%)
million USD
%
0
200
400
600
800
1.000
0
20
40
60
80
100
2008 2009 2010 2011 2012 2013 2014 2015 2016
African Group (1000 $)
Asian Group (1000 $)
Arab Group (1000 $)
OIC Total (1000 $)
African share in total fish imp. (%)
Asian share in total fish imp. (%)
1000 USD
%