


 112 / 272

Reviewing Agricultural Trade Policies
To Promote Intra-OIC Agricultural Trade
100
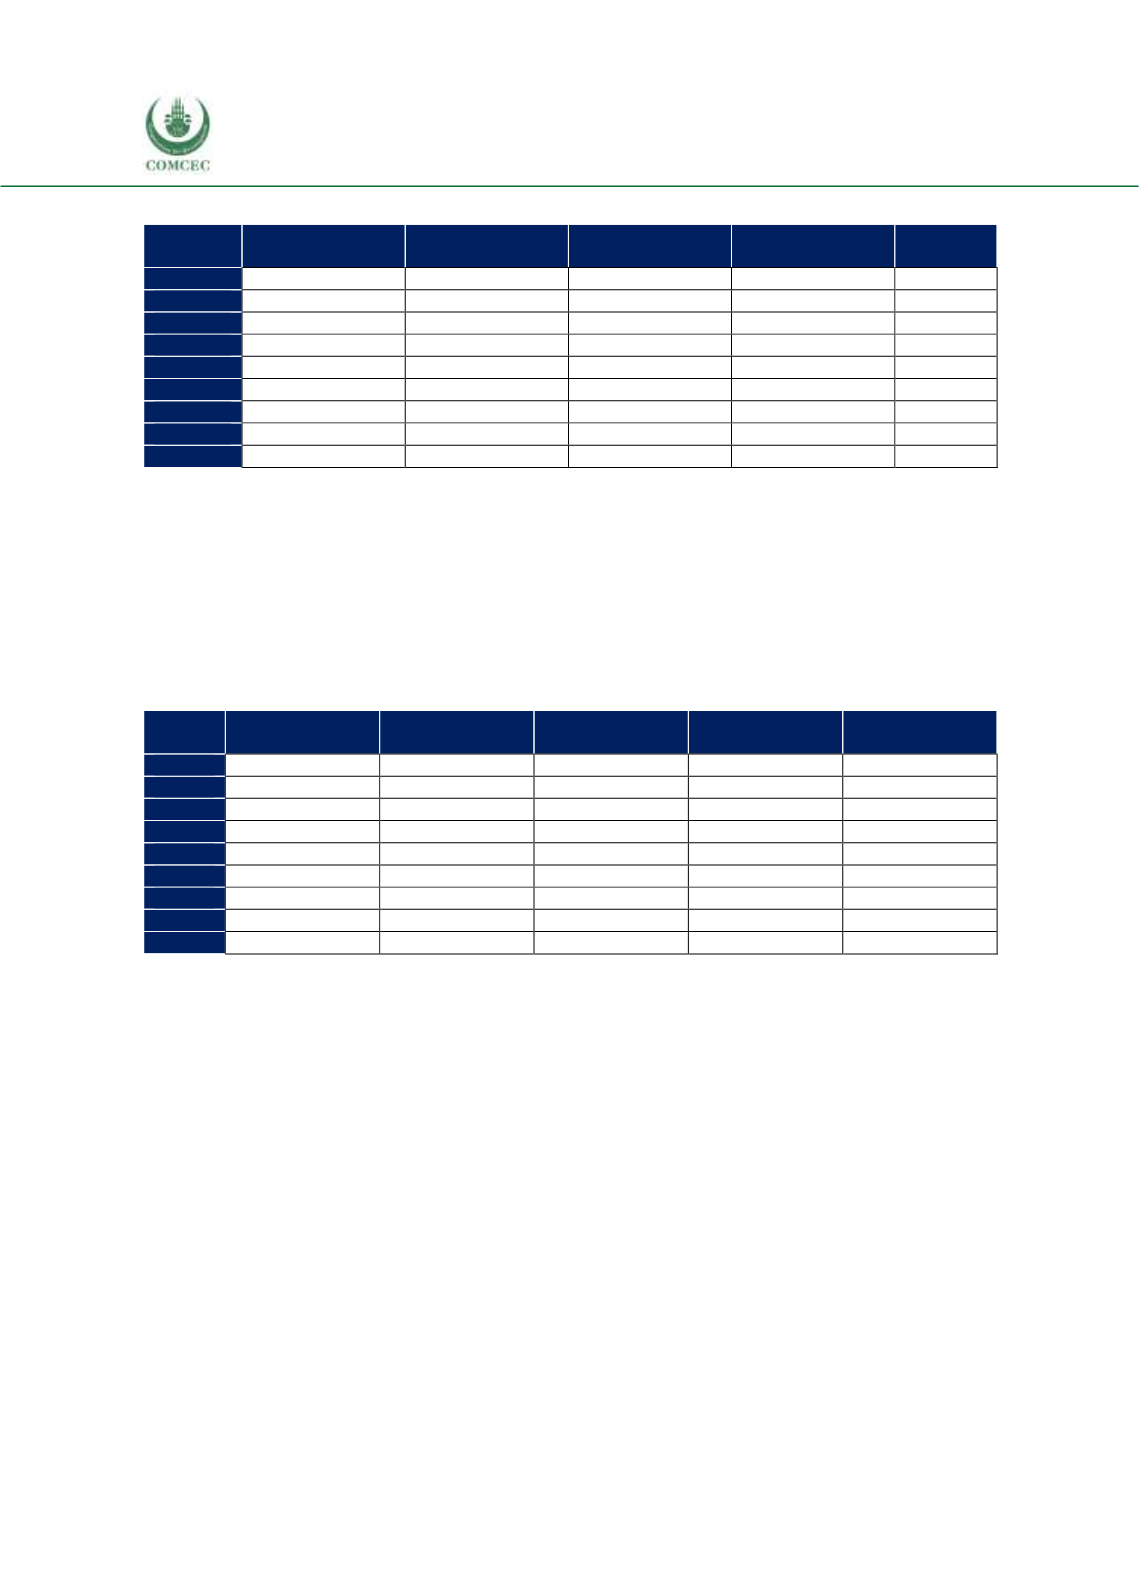
Table 4. 17 Distribution of Morocco’s Top 5 Export Products, by Destination, %
African group
Asian group
Arab group
Non-OIC
Countries
Total
2008
1.3
0.3
3.3
95.1
100
2009
1.3
0.2
4.1
94.4
100
2010
1.0
0.6
3.7
94.8
100
2011
0.8
0.4
2.5
96.2
100
2012
1.0
0.5
3.5
94.9
100
2013
1.8
1.2
3.1
93.9
100
2014
2.4
1.5
2.9
93.2
100
2015
4.4
1.9
6.0
87.7
100
2016
3.4
2.4
6.2
87.9
100
Source: CEPII BACI, Eurostat RAMON, UN Comtrade, UN Trade Statistics, and authors’ calculations
The distribution of Morocco’s top 5 agricultural exports to the OIC according to destination has
been shown in Table 4.17. The share of non-OIC countries in total OIC exports of top five
agricultural export products has declined from 95.1% to 87.9% from 2008 to 2016. During the
observation period, all country groups exhibited increases in shares of total exports at the
expense of non-OIC countries, with Arab group’s share increasing from 3.3% to 6.2%, followed
by African group and Asian group with their respective increases from 1.3% to 3.4% and 0.3%
to 2.4%.
Table 4. 18 Distribution of Morocco’s Top 5 Import Products, by Origin, %
African group
Asian group
Arab group
Non-OIC
Countries
Total
2008
0.5
0.6
11.5
87.4
100
2009
1.2
0.8
9.8
88.1
100
2010
0.6
0.3
8.5
90.5
100
2011
0.7
0.6
7.5
91.2
100
2012
0.3
0.2
7.9
91.5
100
2013
1.3
0.4
9.3
89.1
100
2014
1.4
0.4
8.1
90.2
100
2015
2.1
0.5
11.8
85.6
100
2016
2.5
0.5
10.5
86.5
100
Source: CEPII BACI, Eurostat RAMON, UN Comtrade, UN Trade Statistics, and authors’ calculations
The distribution of Morocco’s top 5 import products from OIC countries according to the region
of origin has been shown in Table 4.18. The share of non-OIC countries did not change much
during the 2008-2016 period. As of 2016, Arab group accounts for the major share in total OIC
imports, despite exhibiting a slight decrease from 11.5% in 2008 to 10.5% in 2016. During the
same period, Asian group’s share remained relatively stable, while African group’s share slightly
increased from 0.5% to 2.5%.
It has been shown in Table 4.19 that Turkey is the largest importer of Morocco’s top five
agricultural export products in the OIC market. The share of Turkey in the last available three-
year average is 16.9%, followed by Lebanon, Côte d'Ivoire and Mauritania with their respective
shares of 8.7, 8.2, and 6.7. The higher shares are due to the geographic proximity of these three
countries to Morocco. The fifth largest market is Syria, for which the lower share can again be
associated with the ongoing conditions.