


 110 / 272

Reviewing Agricultural Trade Policies
To Promote Intra-OIC Agricultural Trade
98
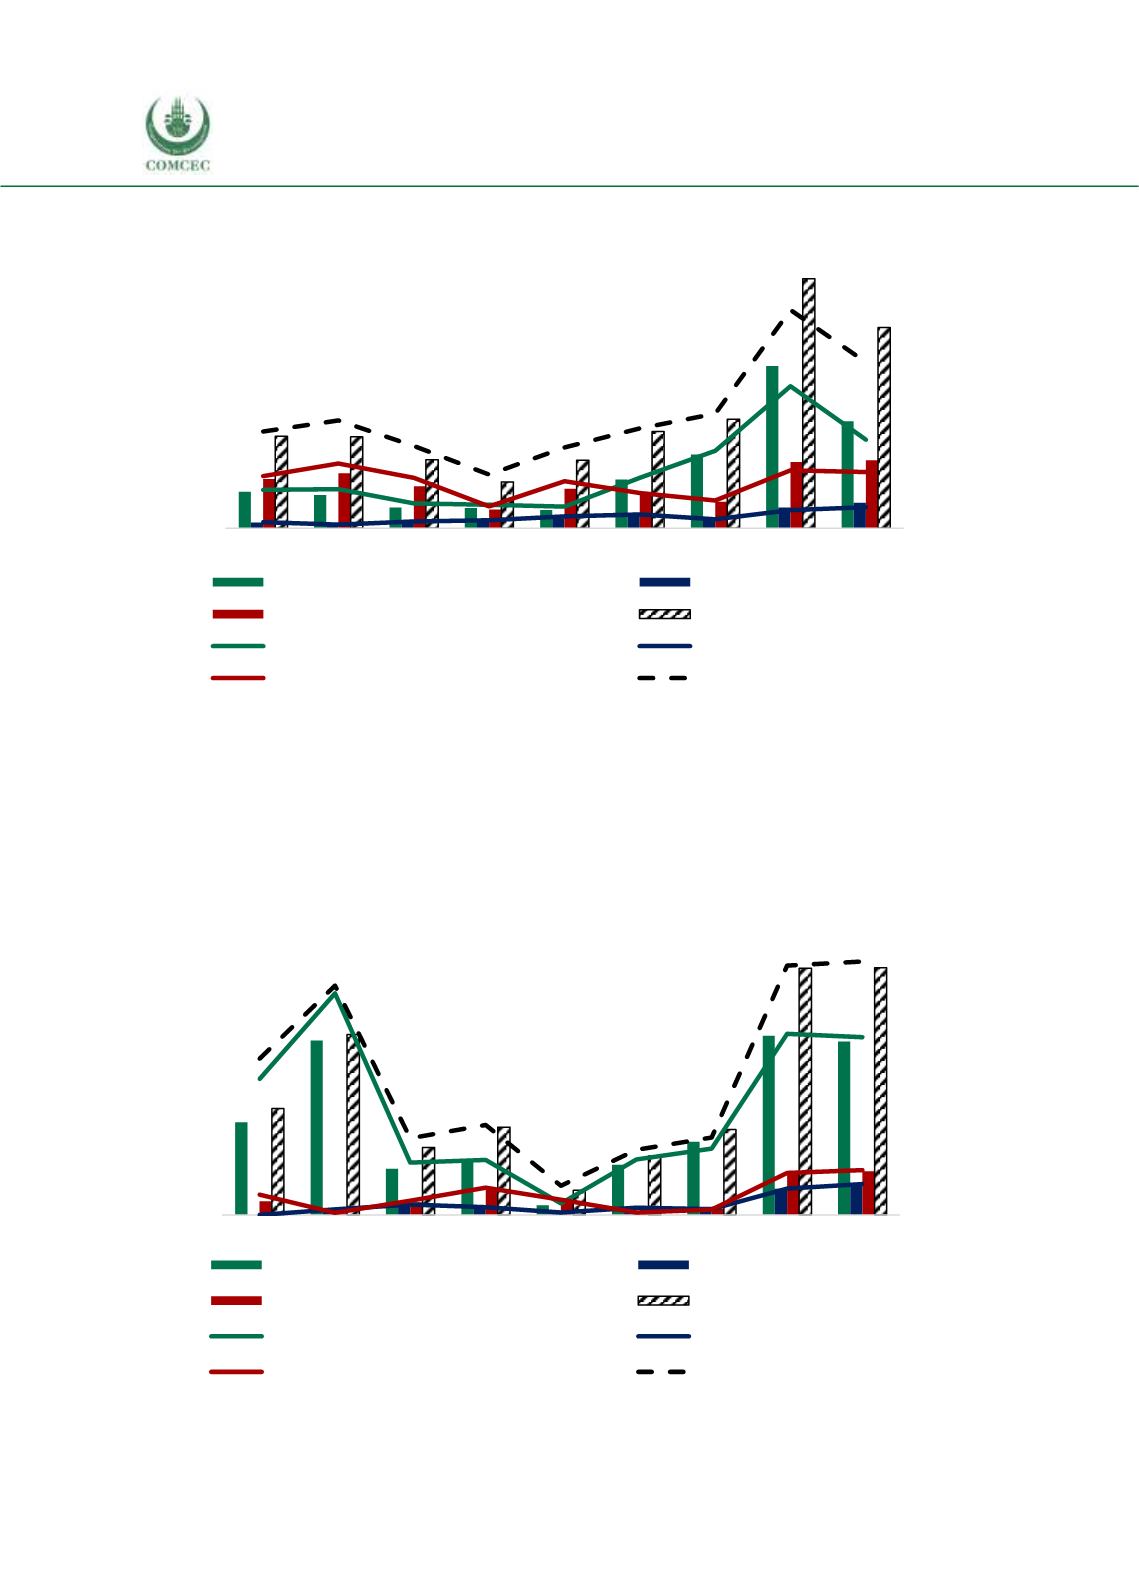
Figure 4. 23 Exports of Morocco’s Fish Products to the OIC Groups
Source: CEPII BACI, Eurostat RAMON, UN Comtrade, UN Trade Statistics, and authors’ calculations
It has been shown in Figure 4.24 that African group has the largest share in fish imports of
Morocco, followed by Arab group and Asian group. After a decline to 0.3% in 2012 from 3% in
2008, the share of African group increased to 4% in 2016. Arab and Asian groups constitute a
relatively small part of fish imports; however, shares of both groups slightly increased during
the 2008-2016 period.
Figure 4. 24 Imports of Morocco’s Fish Products from the OIC Groups
Source: CEPII BACI, Eurostat RAMON, UN Comtrade, UN Trade Statistics, and authors’ calculations
0
50
100
150
200
250
300
0
3
6
9
12
15
18
2008 2009 2010 2011 2012 2013 2014 2015 2016
African Group (million USD)
Asian Group (million USD)
Arab Group (million USD)
OIC Total (million USD)
African share in total fish exp. (%)
Asian share in total fish exp. (%)
Arab share in total fish exp. (%)
OIC share in total fish exp. (%)
million USD
%
0
2
4
6
8
10
12
0
1
2
3
4
5
6
2008 2009 2010 2011 2012 2013 2014 2015 2016
African Group (million USD)
Asian Group (million USD)
Arab Group (million USD)
OIC Total (million USD)
African share in total fish imp. (%)
Asian share in total fish imp. (%)
Arab share in total fish imp. (%)
OIC share in total fish imp.
(%)
million USD
%