


 108 / 272

Reviewing Agricultural Trade Policies
To Promote Intra-OIC Agricultural Trade
96
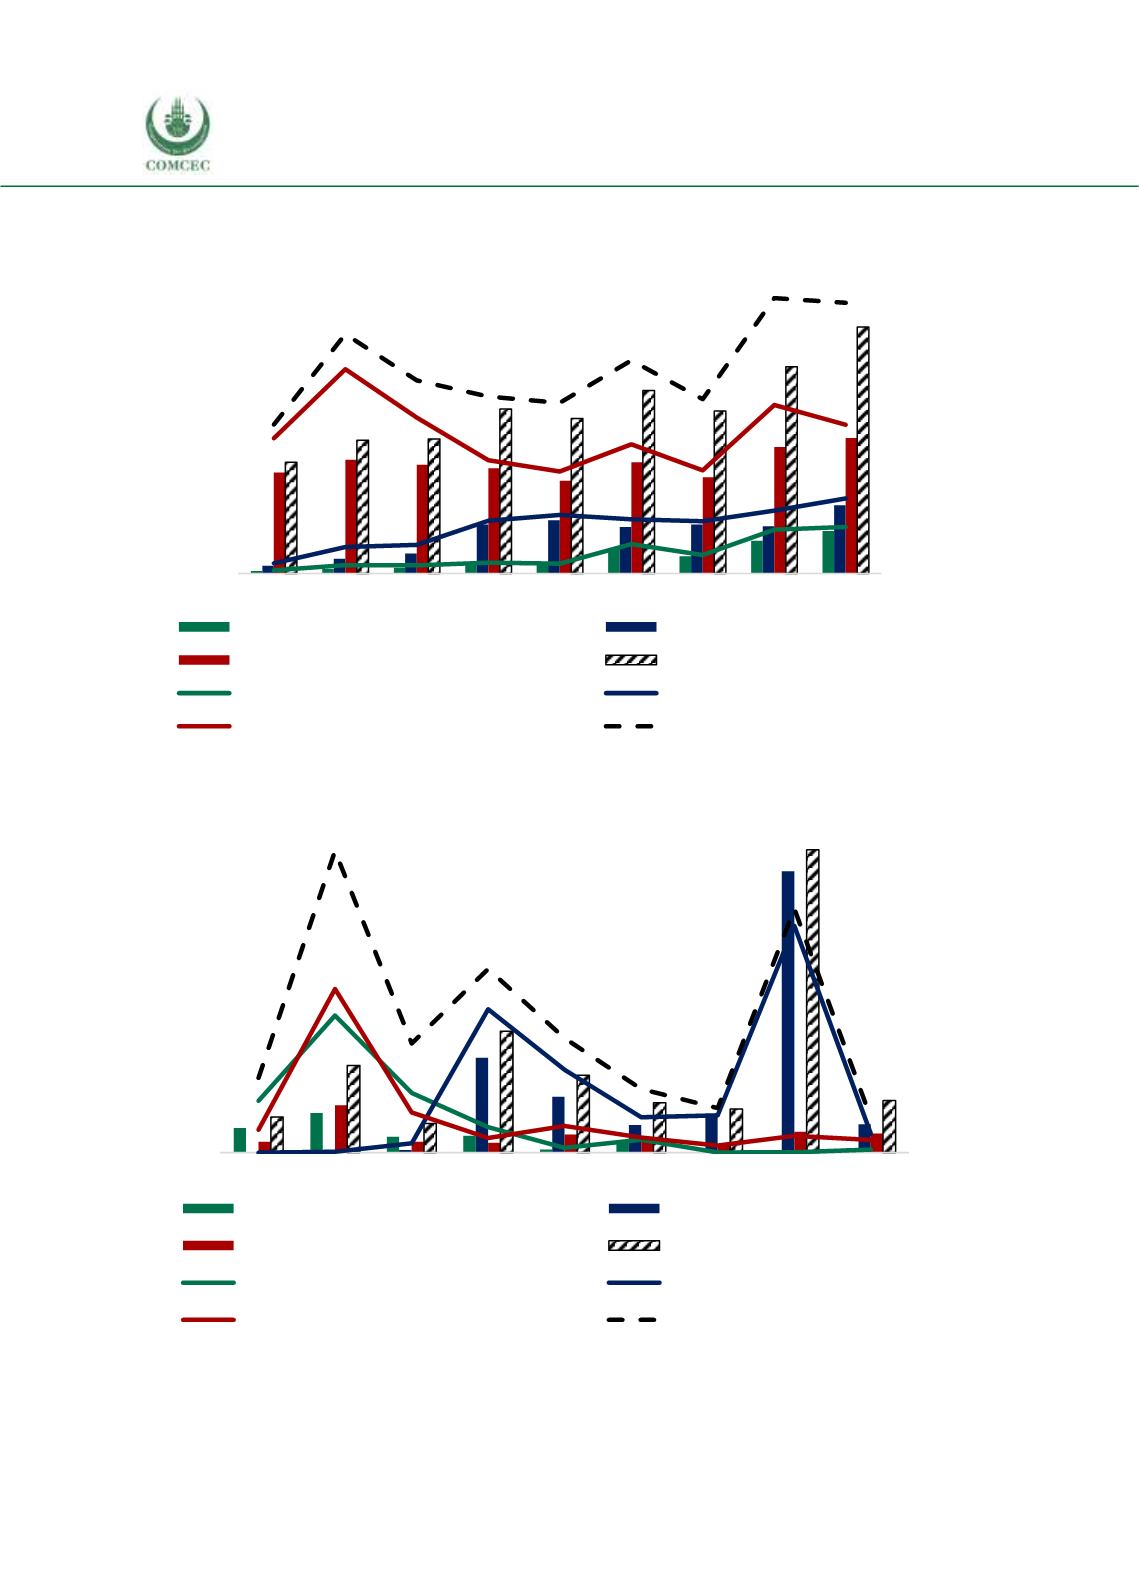
Figure 4. 20 Imports of Morocco’s Agri-Food Products from the OIC Groups
Source: CEPII BACI, Eurostat RAMON, UN Comtrade, UN Trade Statistics, and authors’ calculations
Figure 4. 21 Exports of Morocco’s Agricultural Raw Materials to the OIC Groups
Source: CEPII BACI, Eurostat RAMON, UN Comtrade, UN Trade Statistics, and authors’ calculations
0
100
200
300
400
500
600
0
2
4
6
8
10
12
2008 2009 2010 2011 2012 2013 2014 2015 2016
African Group (million USD)
Asian Group (million USD)
Arab Group (million USD)
OIC Total (million USD)
African share in total agri-food imp. (%)
Asian share in total agri-food imp. (%)
Arab share in total agri-food imp. (%)
OIC share in total agri-food imp. (%)
%
million USD
0
1
2
3
4
5
6
0
5
10
15
20
25
30
2008 2009 2010 2011 2012 2013 2014 2015 2016
African Group (million USD)
Asian Group (million USD)
Arab Group (million USD)
OIC Total (million USD)
African share in total agri-raw exp. (%)
Asian share in total agri-raw exp. (%)
Arab share in total agri-raw exp. (%)
OIC share in total agri-raw exp.
(%)
million USD
%