


 107 / 272

Reviewing Agricultural Trade Policies
To Promote Intra-OIC Agricultural Trade
95
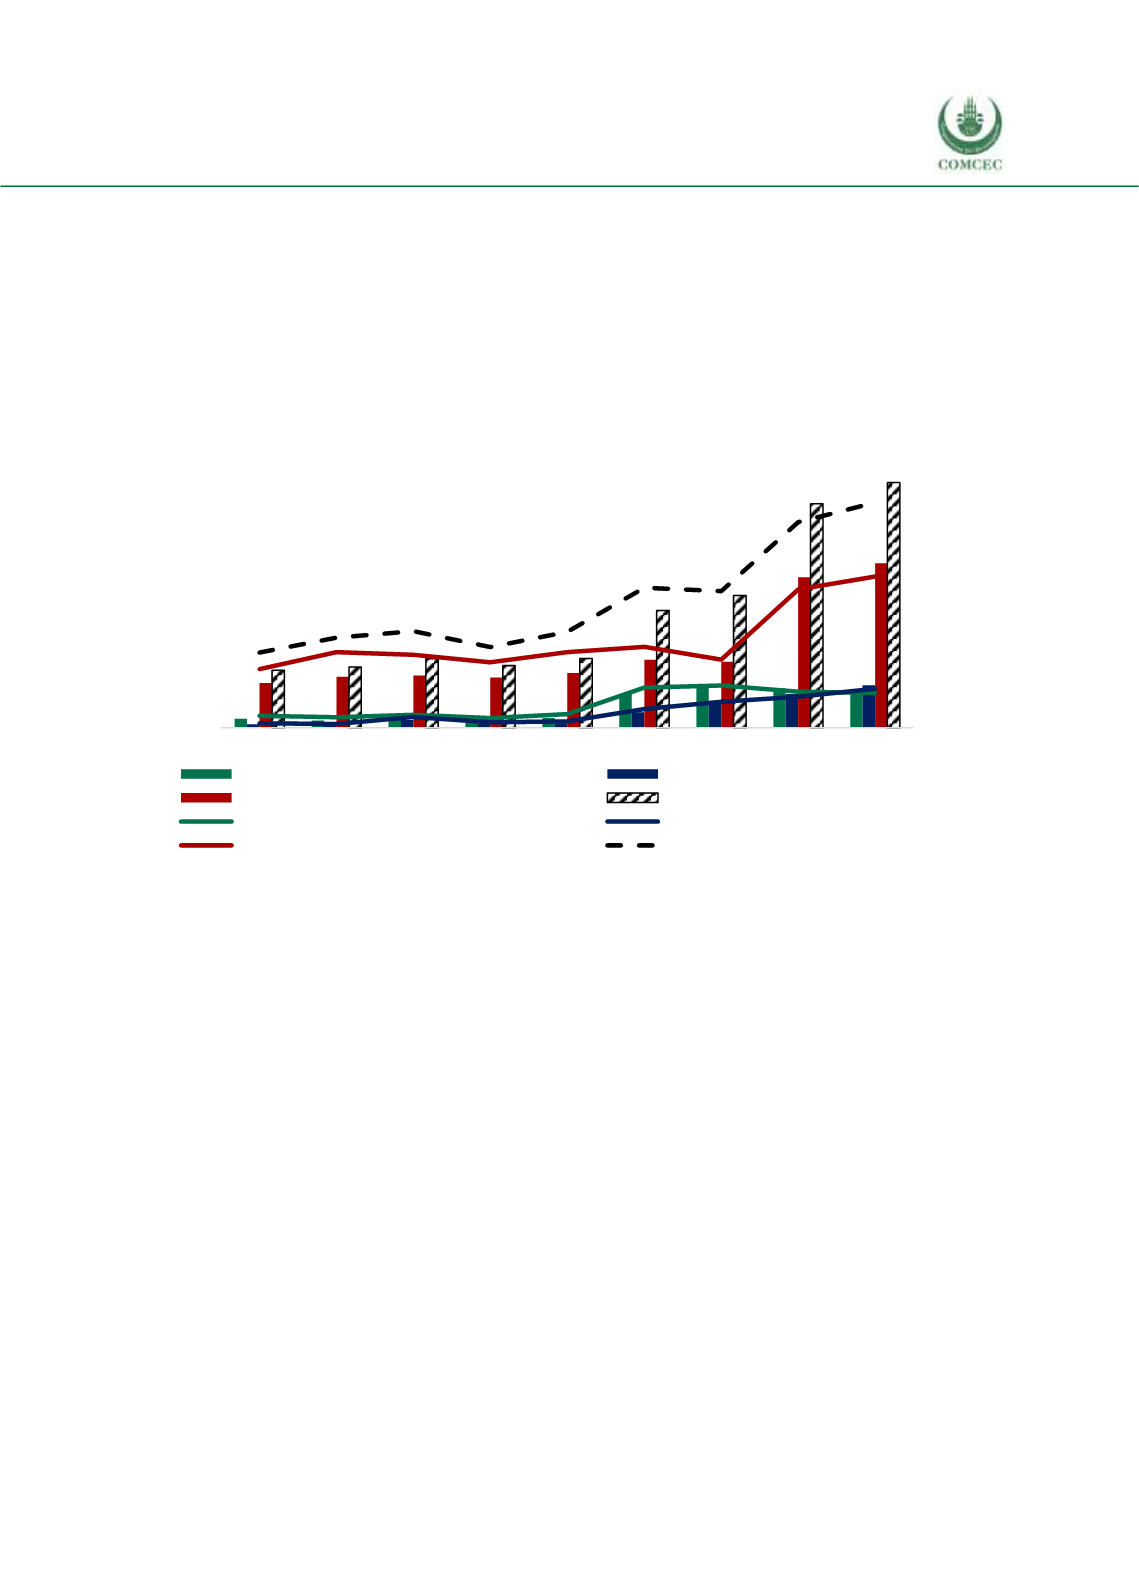
With regards to the distribution of exports across country groups and product groups, it has
been shown in Figure 4.15 that the OIC country groups all have increasing shares in Morocco’s
agri-food exports.
Arab group’s share increased from 4.2% to 10.8% from 2008 to 2016, with an increase from 0.1
billion USD to 0.4 billion USD. Asian and African groups have small but gradually increasing
shares during the period.
Asian group’s share increased from 0.3% to 2.8%, while African group’s share increased from
0.9% to 2.5% for 2008 and 2016, respectively.
Figure 4. 19 Exports of Morocco’s Agri-Food Products to the OIC Groups
Source: CEPII BACI, Eurostat RAMON, UN Comtrade, UN Trade Statistics, and authors’ calculations
The total share of OIC countries in Morocco’s agri-food imports increased from 5.4% to 9.9%
during the 2008-2016 period. Arab group recovered from a decrease to 3.7% in 2012 from4.9%
in 2008, with an increase to 5.4% in 2016. During the same period, African group and Asian
group both experienced increases in shares, with Asian group’s share increasing from 0.4 to
2.7%, while African group’s share increasing from 0.1% to 1.7%.
0
100
200
300
400
500
600
0
3
6
9
12
15
18
2008 2009 2010 2011 2012 2013 2014 2015 2016
African Group (million USD)
Asian Group (million USD)
Arab Group (million USD)
OIC Total (million USD)
African share in total agri-food exp. (%)
Asian share in total agri-food exp. (%)
Arab share in total agri-food exp. (%)
OIC share in total agri-food exp. (%)
%
million USD