


 109 / 272

Reviewing Agricultural Trade Policies
To Promote Intra-OIC Agricultural Trade
97
It has been shown in Figure 4.21 that the total share of OIC country groups in Morocco’s
agricultural raw material exports decreased from 2008 to 2016. Exhibiting notable fluctuations
within the range of 0% and 21.4%, Asian group’s share is 1.8% in 2016. Arab and African groups
both exhibited decreasing shares in exports, with the share of Arab group decreasing from 2.2%
to 1.2%, and the share of African group decreasing from 4.9% to 0.3% from 2008 to 2016.
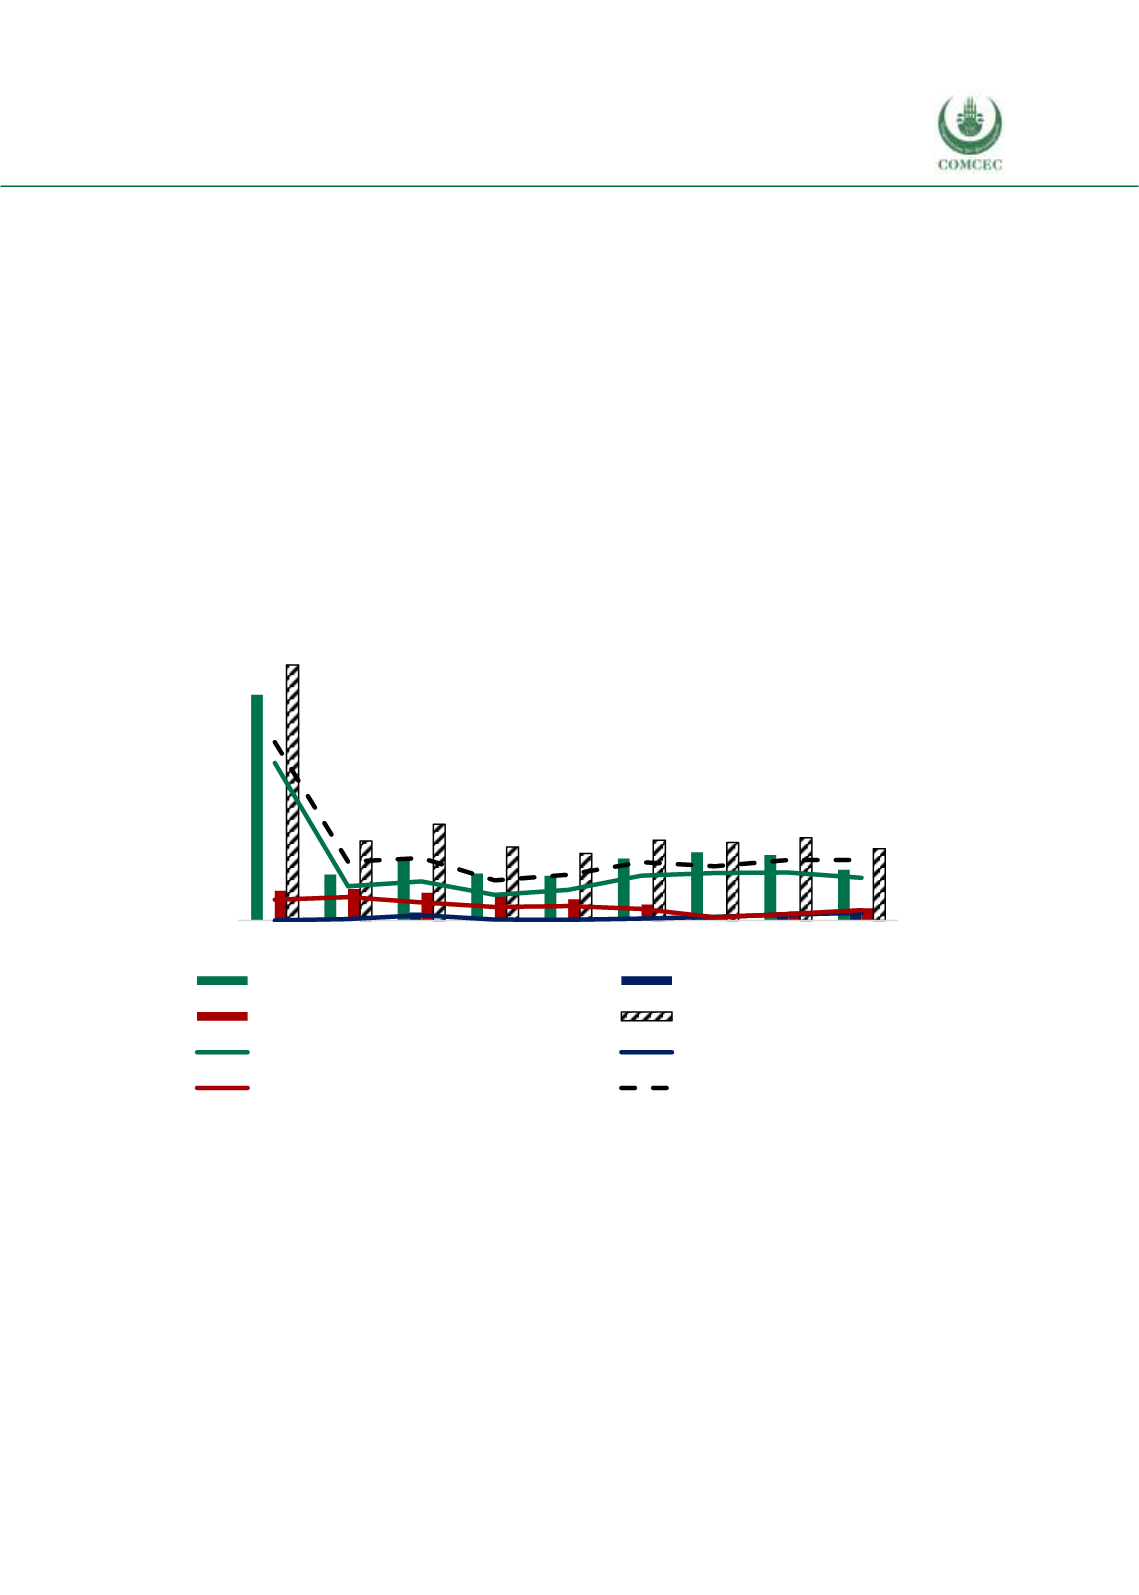
The decline in the total share of OIC country groups in Morocco’s agricultural raw material
imports has been shown in Figure 4.18. African group has the largest share of the three groups,
but their share decreased from 5.4% to 1.5% from 2008 to 2016. Arab and Asian groups account
for a very small part of agricultural raw material exports.
It has been illustrated in Figure 4.23 that African group has the highest share in Morocco’s fish
exports, followed by Arab group and Asian group. African group’s share increased from 2.4% to
5.5% during the 2008-2016 period. Arab group’s share of fish exports of Morocco moved within
the range of 1.4% and 4.1% during the same period. Accounting for a small part of fish exports,
Asian group’s share increased from 0.4% to 1.3% from 2008 to 2016.
Figure 4. 22 Imports of Morocco’s Agricultural Raw Materials from the OIC Groups
Source: CEPII BACI, Eurostat RAMON, UN Comtrade, UN Trade Statistics, and authors’ calculations
0
5
10
15
20
25
0
2
4
6
8
10
2008 2009 2010 2011 2012 2013 2014 2015 2016
African Group (million USD)
Asian Group (million USD)
Arab Group (million USD)
OIC Total (million USD)
African share in total agri-raw imp. (%)
Asian share in total agri-raw imp. (%)
Arab share in total agri-raw imp. (%)
OIC share in total agri-raw imp.
(%)
%
million USD