
Analysis of Agri-Food Trade Structures
To Promote Agri-Food Trade Networks
In the Islamic Countries
16
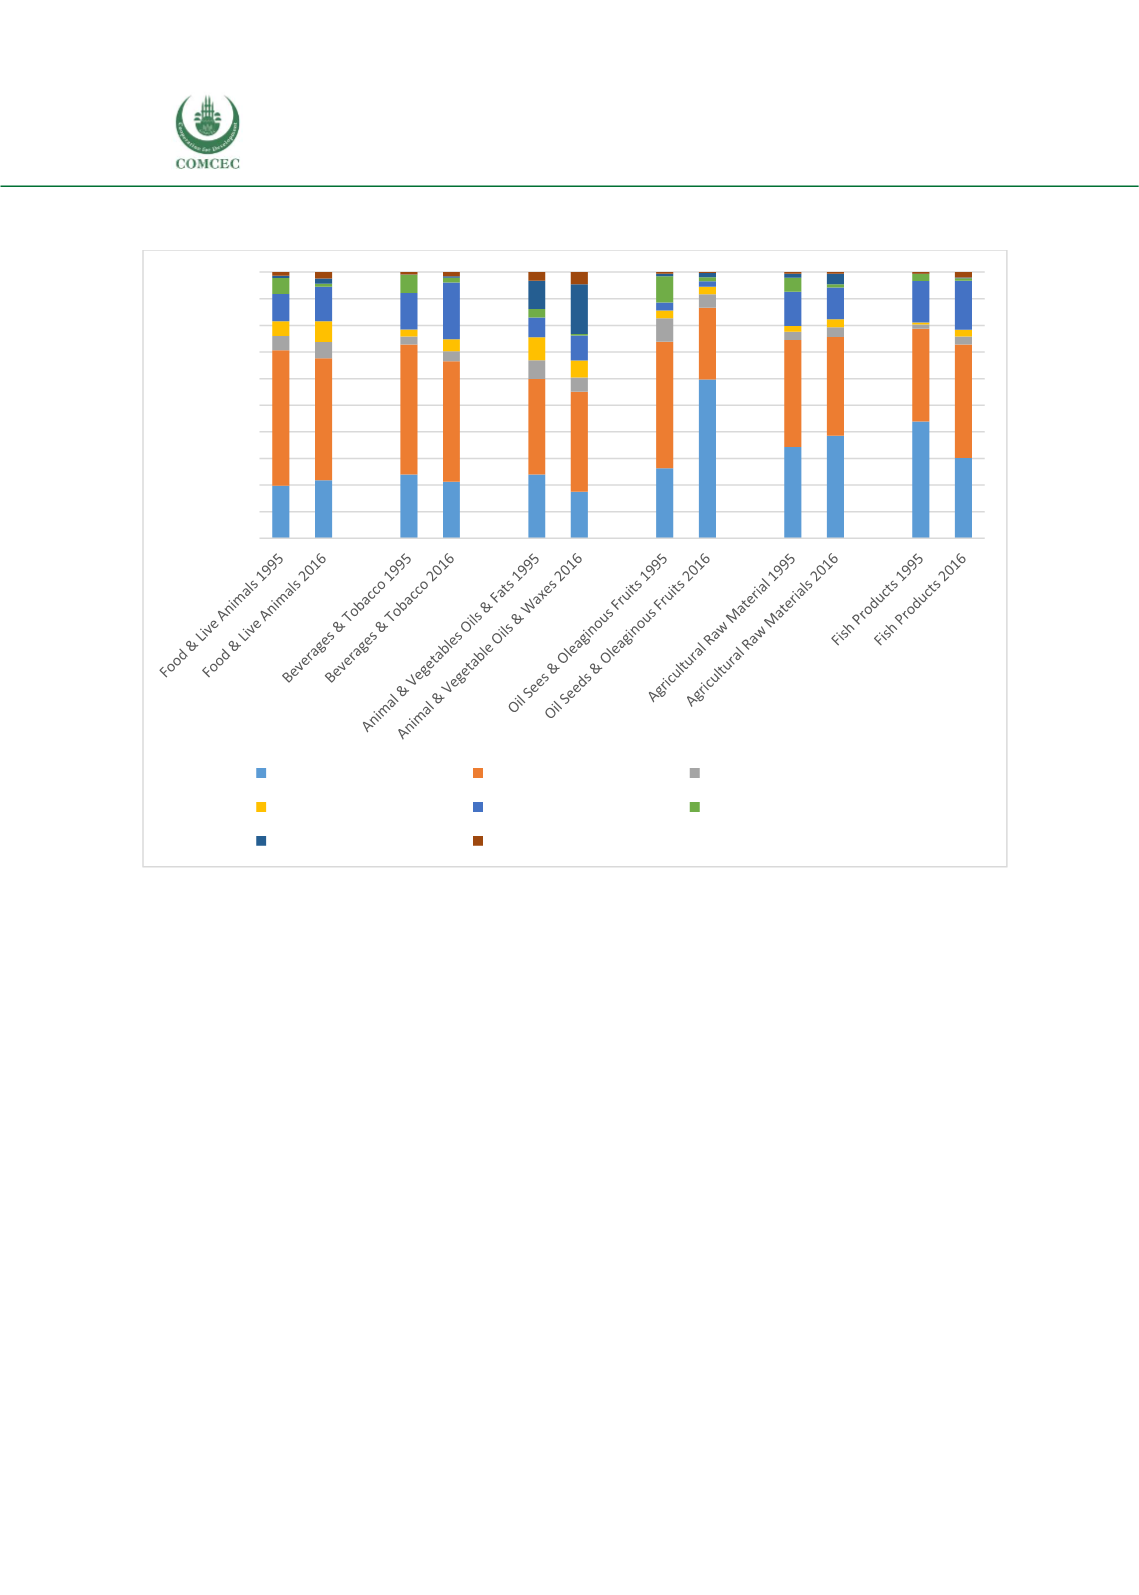
Figure 6: World Imports of Agricultural Products by Section, by Importing Region, 1995-2016,
Percent of Total
Source:
UN Comtrade; and Authors’ calculations.
Examining trade flow patterns like this is informative for studying macro-dynamics of trade
flows, and starting to understand the linkages among regions in different trade product
networks. However, trade flows on their own do not tell us which regions have comparative
advantage in which products. For that analysis, an econometric model is required. As set out in
Section 1, a gravity model approach is used, which provides a theory-consistent measure of
comparative advantage, which is more accurate and informative that atheoretical measures like
the Balassa RCA index. The output is referred to as TRCA, as the authors of the paper liken their
measure to Balassa’s, but highlight the ways in which it is superior.
Table 1 presents results based on average TRCA indices based on an analysis at the division level
due to computational restrictions. Unlike the Balassa index, there is no arbitrary cut-off in this
index to show products of comparative advantage or disadvantage. Rather, analysis requires
comparison of relative number across countries, which is the essence of comparative advantage
in theoretical models. To undertake this comparison, it is easiest to normalize the table by
dividing through by the index scores for live animals. The analysis of this table proceeds by
comparing relative scores, with a higher ratio of the index in one sector relative to another
indicating comparative advantage in the first. Based on such a comparison of relative scores, the
table shows that South Asia has strong comparative advantage in sectors like meat, fish and
crustaceans, cereals, vegetables, sugar products, and crude materials relative to other
agricultural sectors. However, these numbers should be interpreted with caution, as the South
Asia aggregate is composed of a small number of countries relative to other regions. Also,
0%
10%
20%
30%
40%
50%
60%
70%
80%
90%
100%
East Asia & Pacific
Europe & Central Asia
Latin America & Caribbean
Middle East & North Africa North America
Others
South Asia
Sub-Saharan Africa


