


 23 / 152

Analysis of Agri-Food Trade Structures
To Promote Agri-Food Trade Networks
In the Islamic Countries
13
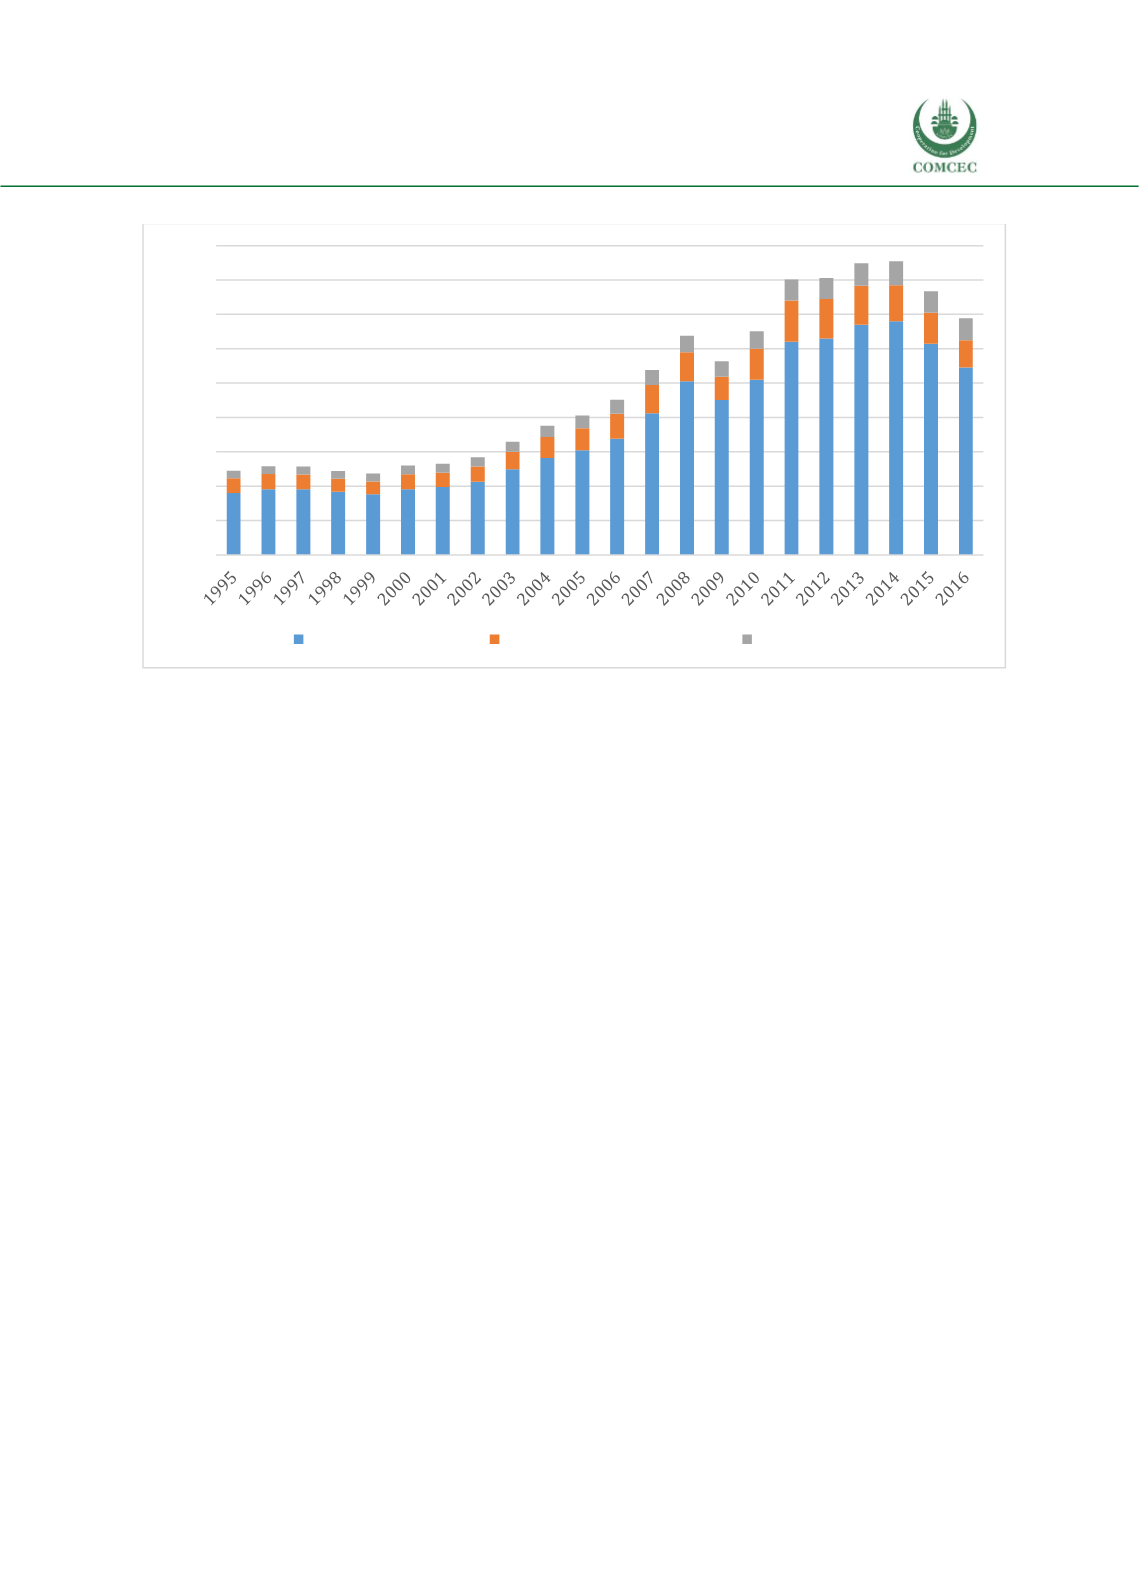
Figure 3: World Exports of Agricultural Products, 1995-2016, by Category, Billion USD
Source:
UN Comtrade; and Authors’ calculations.
The agricultural raw materials and fish products titles only contain one section each, so their
performance over recent decades is already accurately summarized in Figure 3. However, the
agri-food products title contains four sections, so it is important to break the aggregate figures
in Figure 3 out into their component parts. Figure 4 presents results. The bulk of world exports
under this heading are accounted for by section 0 (food and live animals), followed by section 1
(beverages and tobacco), section 22 (oil seeds and oleaginous fruits), and finally section 4
(animal and vegetable oils, fats, and waxes). However, the composition by section varies
considerably over time. In 1995, the breakdown is 76.8% food and live animals, 14.6%
beverages and tobacco, 5.3% animal and vegetable oils, fats, and waxes, and 3.4% oil seeds and
oleaginous fruits. By 2016, however, these percentages have changed to 75.4%, 12.1%, 6.0%,
and 6.5% respectively. At the level of world exports, there is therefore evidence that within the
agri-food products category, dynamism is chiefly located in oil seeds and oleaginous fruits, and
animal and vegetable fats, oils, and waxes. Changes in the relative makeup of this category have
not been radical over recent decades, but secular trends are nonetheless apparent, which have
implications for product specialization by individual countries. The key finding is that the
relative importance of food and live animals is falling over time, as is the case for beverages and
tobacco. However, the relative importance of oils and fats is increasing over time. In other words,
demand is shifting towards the latter two product groups, which means that trade growth is
relatively more rapid. Countries that are specialized in those product groups therefore
experience benefits linked to more rapid export expansion than countries that are specialized
in the first group of sectors.
0
200
400
600
800
1.000
1.200
1.400
1.600
1.800
Agri-Food Products
Agricultural Raw Materials
Fish Products