


 24 / 152

Analysis of Agri-Food Trade Structures
To Promote Agri-Food Trade Networks
In the Islamic Countries
14
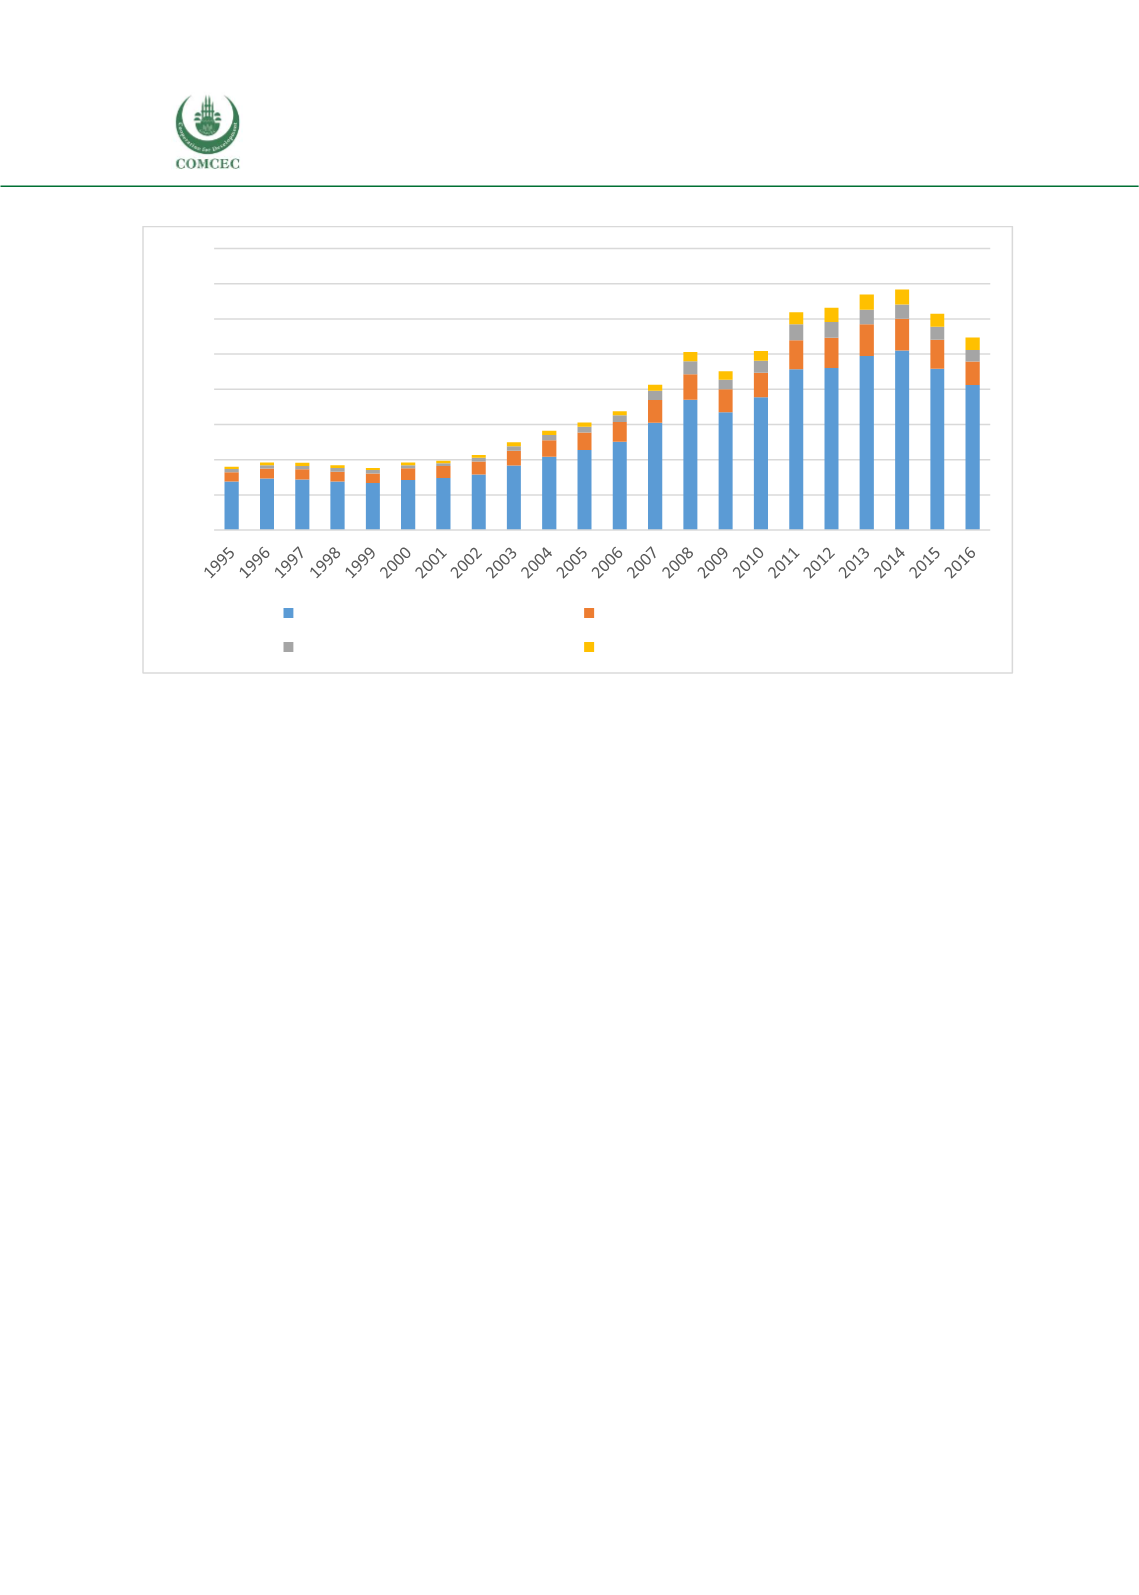
Figure 4: World Exports of Agri-Food Products, by Section, 1995-2016, Billion USD
Source
:
UN Comtrade; and Authors’ calculations.
The analysis thus far has focused on overall world trends in trade in agricultural products, using
data at the overall, title, and section levels of the Annex 1 classification. The remainder of this
subsection tracks world trends in exports by region of origin, to show the geographical evolution
of world trade in agricultural products.
Agri-food products includes a number of different sections, whereas the other two titles only
include one section each. Figure 5 considers all products at the section level separately, to
investigate whether or not different export dynamics are in evidence in terms of the
geographical distribution of exports. To enable presentation of all information in a single figure,
we focus on the two extreme years of the sample only, namely 1995 and 2016. The difference
between the two represents the trend in export dynamics over time. In all cases, the figure uses
percentages of total exports, and so does not examine differences in the relative sizes of sectors
over time; that issue has already been dealt with above.
In the first two sections of agri-food, namely, “food and live animals” and “beverages and
tobacco”, Europe and Central Asia is the dominant exporting region. However, the picture
changes for the last two sections, namely “animal and vegetable oils, fats and waxes” and
“oilseeds and oleaginous fruits”. East Asia and the Pacific, as well as Europe and Central Asia, is
a major exporter of animal and vegetable fats, oils, and waxes. Finally, North America and Latin
America and the Caribbean are the dominant exporting regions for oil seeds and oleaginous
fruits. All four sections under this title show a reasonable degree of stability over time in terms
of the distribution of export origins. Sharp changes are likely due to reporting difficulties, as not
all countries report trade data with the same lag period.
For agricultural raw materials, Europe and Central Asia, as well as East Asia and the Pacific, and
North America are major exporters. The pattern of exports across geographical regions is
relatively stable over time. The final section in the Annex 1 product classification is fish products.
In this case, the leading exporters are East Asia and the Pacific, as well as Europe and Central
0
200
400
600
800
1.000
1.200
1.400
1.600
Food & Live Animals
Beverages & Tobacco
Animal & Vegetable Oils Fats & Waxes Oil Seeds and Oleaginous Fruits