


 22 / 152

Analysis of Agri-Food Trade Structures
To Promote Agri-Food Trade Networks
In the Islamic Countries
12
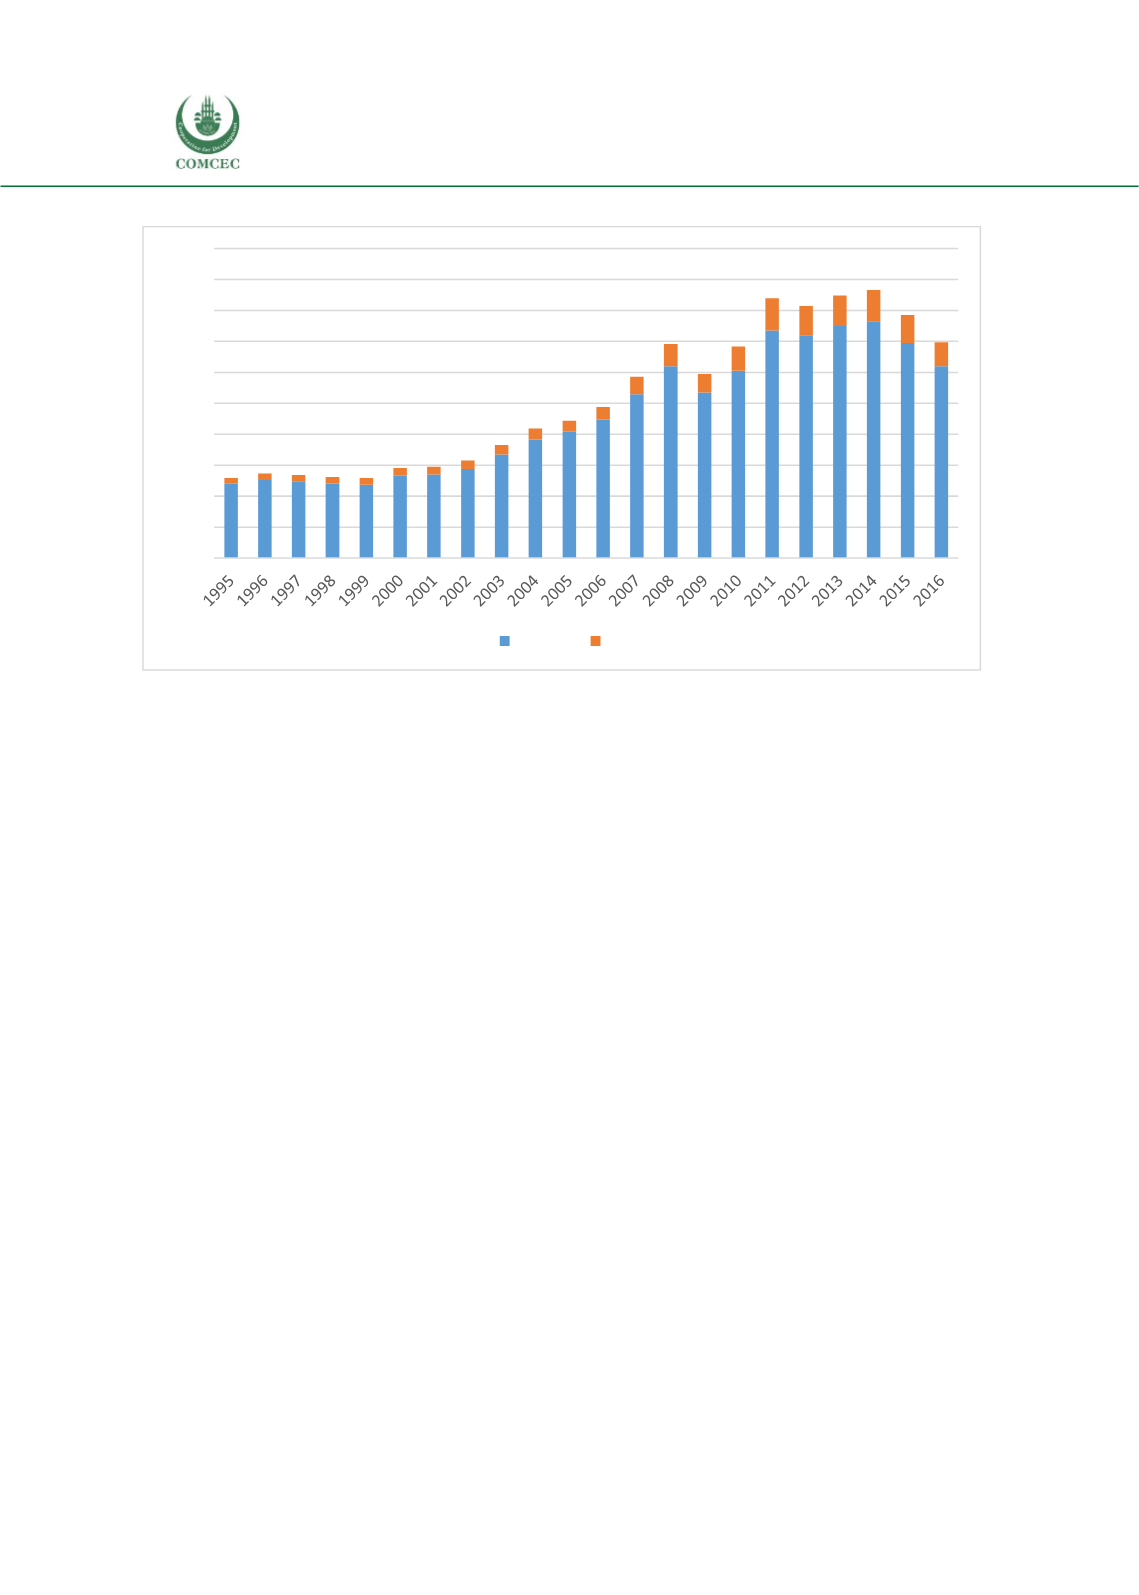
Figure 2: World Imports of Agricultural Products, 1995-2016, OIC versus non-OIC, Billion USD
Source: UN Comtrade; and authors’ calculations.
To provide a preliminary indication of the importance of different products in global agri-food
trade, Figure 3 presents a breakdown of world exports bymain product category (title) in Annex
1. (Where breakdowns by country are not relevant, world exports equal world imports, subject
to a small amount of measurement error; it is therefore appropriate to use export data only.)
The main bulk of world exports are accounted for by agri-food products, although the relative
balance among the three title categories varies significantly over time. In 1995, agricultural raw
materials constituted 17.5% of the total, but by 2016, that number had fallen to 11.5%. By
contrast, fish products stood at 8.9% in 1995, but by 2016 had risen to 9.4%. These differences
show that the sources of export market dynamism are quite different across sectors. Indeed, as
these figures suggest, growth rates of exports have differed significantly across sectors.
Agricultural raw materials grew the slowest, at an average annualized rate of 3.0%, compared
with 5.3% for fish products, and 5.4% for agri-food products. These dynamics are important,
because they have implications for the export dynamism of economies that specialize in each
type of product. All countries, particularly those in the low and middle income groups, are
focused on growing trade linkages rapidly as one way of supporting sustained productivity and
income growth. Specialization in agri-food products is therefore associated with more rapid
trade growth than trade in agricultural raw materials, likely related to the fact that agri-food
products can involve some level of processing. Although the difference in annualized growth
rates is relatively small, over time the effect of compounding is significant. For example, 3.0%
annual growth over ten years leads to a cumulative 34% increase in trade, but 5.4% annual
growth leads to a cumulative 69% increase in trade, or slightly over double the effect.
0
200
400
600
800
1.000
1.200
1.400
1.600
1.800
2.000
Non-OIC OIC