


 31 / 152

Analysis of Agri-Food Trade Structures
To Promote Agri-Food Trade Networks
In the Islamic Countries
21
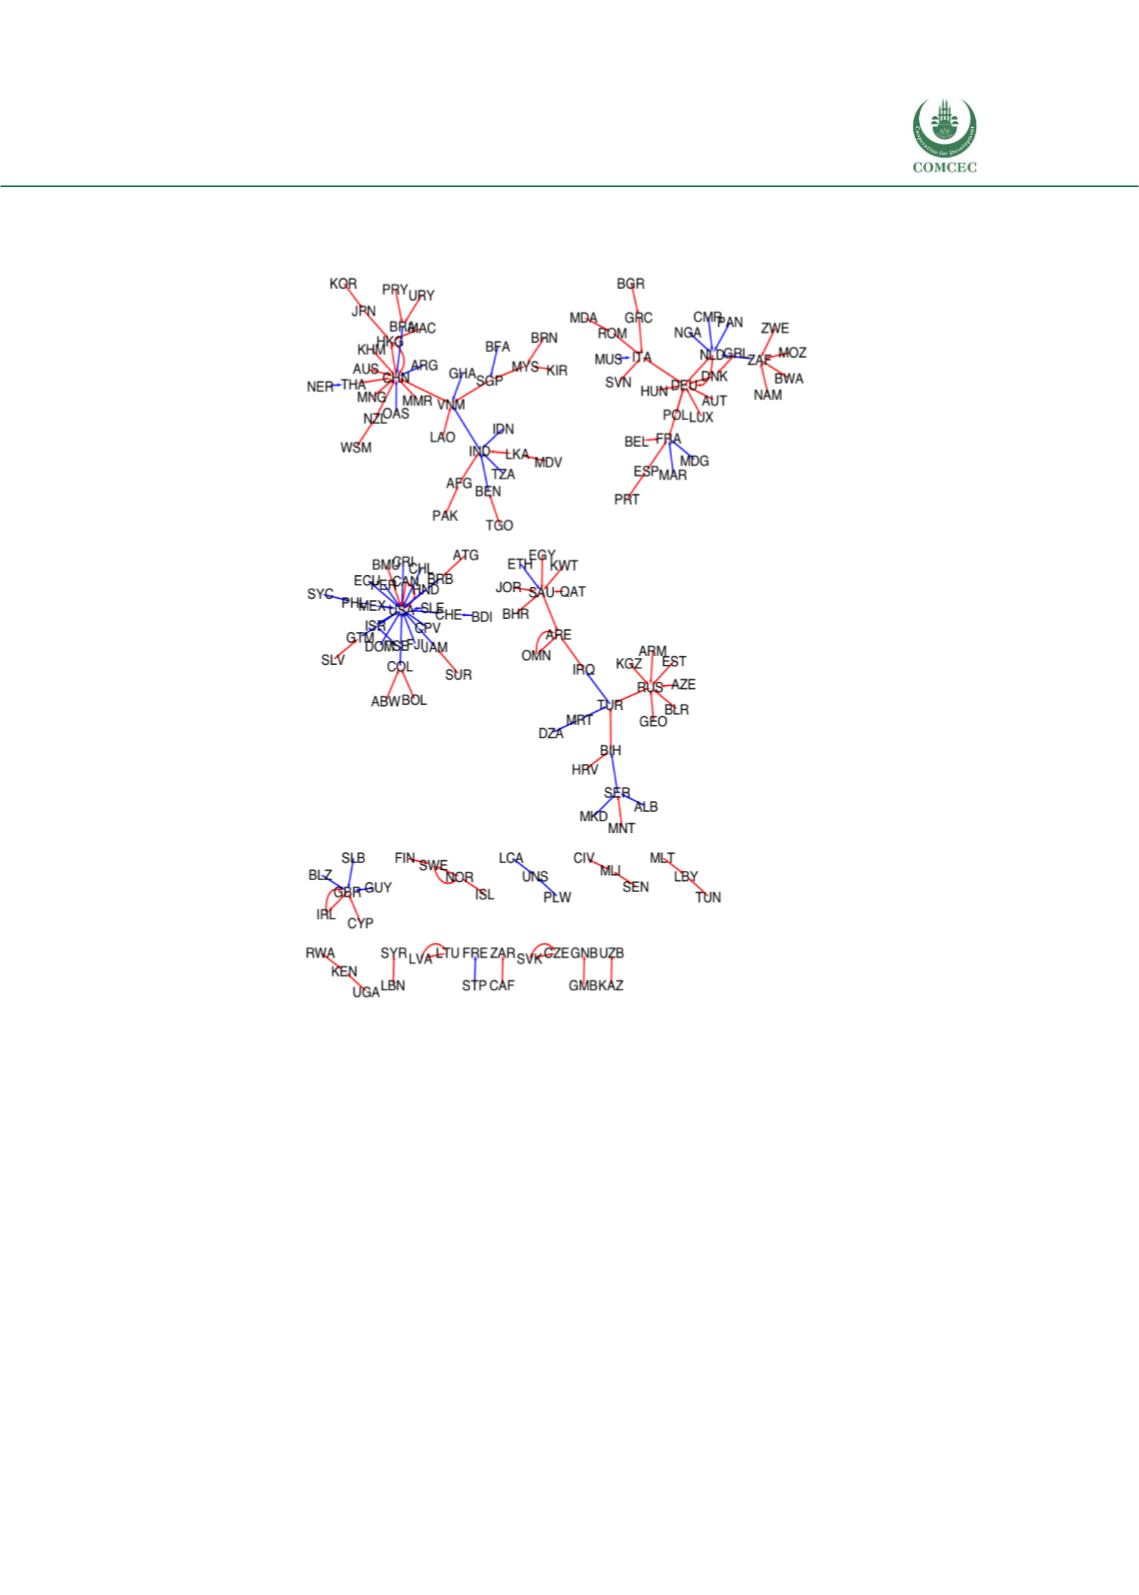
Figure 9: Graphical Representation of the Global Trade Network in Agri-Food Products,
Largest Flow Only, 2016
Source: Authors’.
To quantify the above insights, it is possible to use the metrics of centrality discussed in Section
1. The first is out degree centrality, which is the number of export partners of each country in
this sector. This measure is an indicator of export diversification. Table 2 column 1 presents
results. Clearly, the degree to which countries have a geographically diversified range of export
markets is linked to their geography and income level. Countries in North America have, on
average, nearly four times as many export destinations as countries in Sub-Saharan Africa.
Europe and Central Asia also performs relatively strongly, but the other regions have far fewer
export links than the leading region.
Column 2 of Table 2 presents results on eigenvector centrality, which weights each country’s
export destinations by importance using an iterative procedure. As discussed in Section 1, this
measure summarizes a country’s location in the network. Results are not as stark as for out
degree centrality, but the pattern is largely the same. However, although North America is the
leading region, its average score is not much higher than that of Europe and Central Asia, which