
Analysis of Agri-Food Trade Structures
To Promote Agri-Food Trade Networks
In the Islamic Countries
19
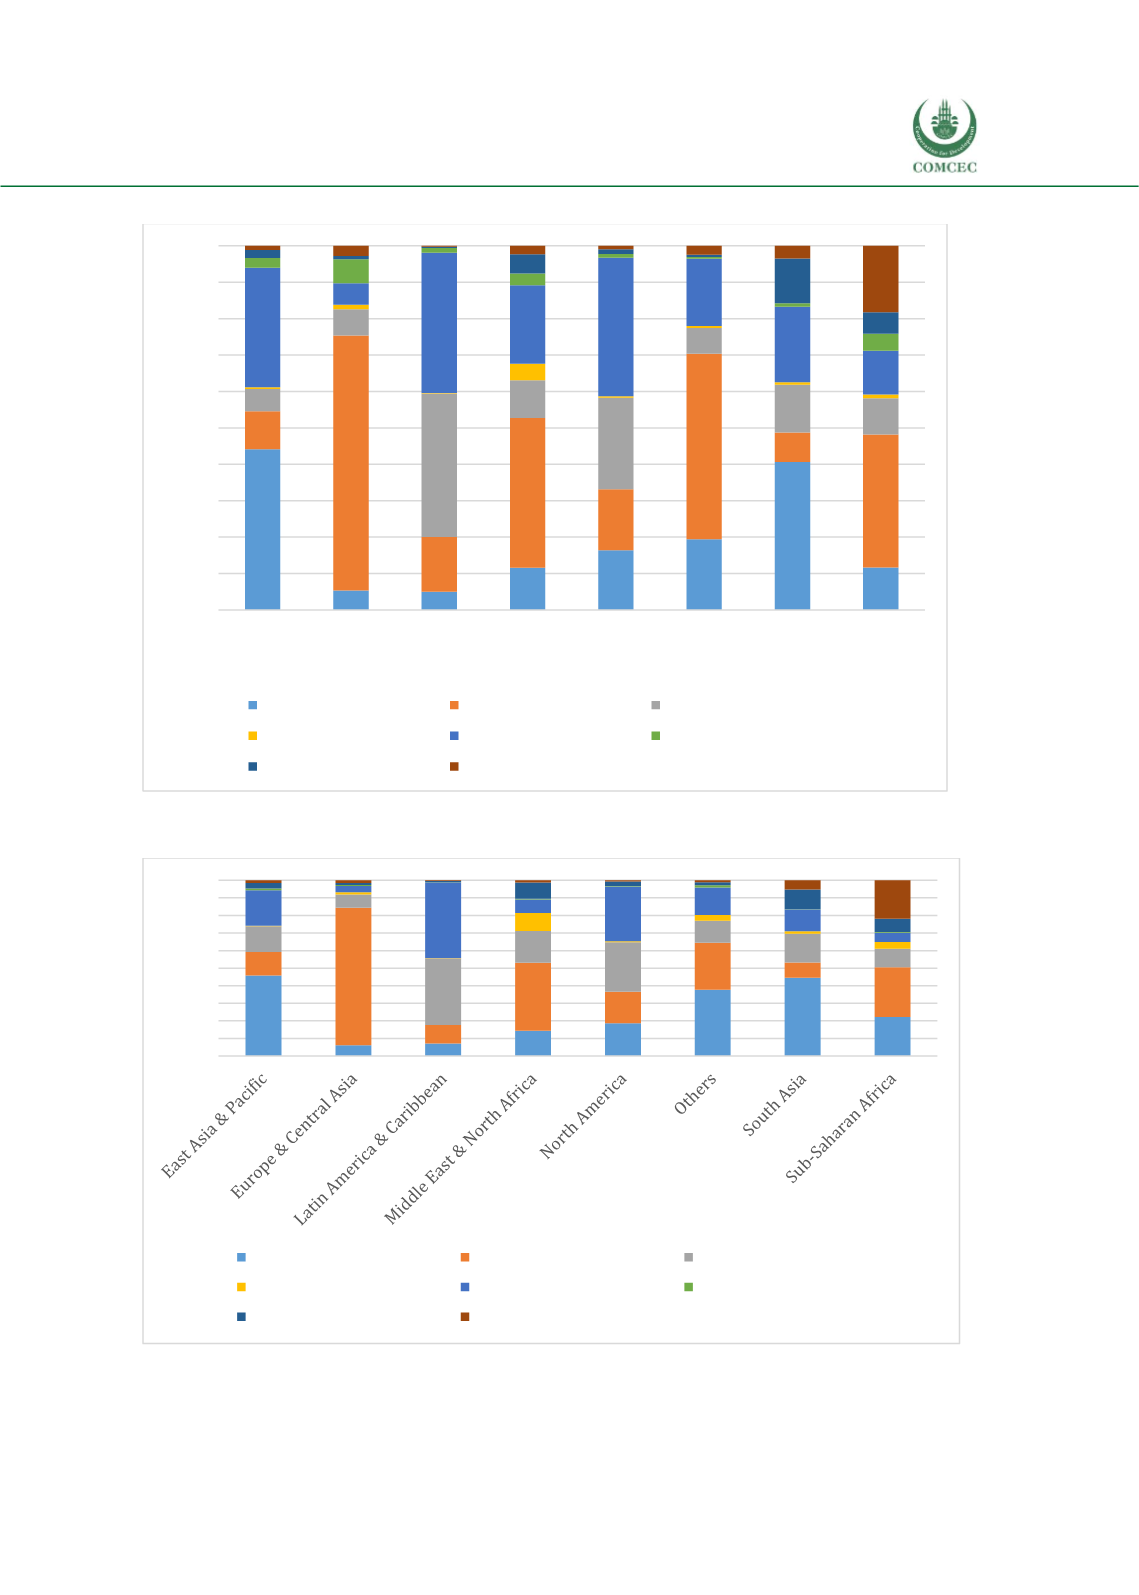
Figure 7: Exports of Agricultural Products, by Importing Region, Percent of Total, 1995
Source: UN Comtrade; and Authors’ calculations.
Figure 8: Exports of Agricultural Products, by Importing Region, Percent of Total, 2016
Source: UN Comtrade; and Authors’ calculations.
0%
10%
20%
30%
40%
50%
60%
70%
80%
90%
100%
East Asia &
Pacific
Europe &
Central Asia
Latin
America &
Caribbean
Middle East
& North
Africa
North
America
Others South Asia Sub-Saharan
Africa
East Asia & Pacific
Europe & Central Asia
Latin America & Caribbean
Middle East & North Africa North America
Others
South Asia
Sub-Saharan Africa
0%
10%
20%
30%
40%
50%
60%
70%
80%
90%
100%
East Asia & Pacific
Europe & Central Asia
Latin America & Caribbean
Middle East & North Africa
North America
Others
South Asia
Sub-Saharan Africa


