
Analysis of Agri-Food Trade Structures
To Promote Agri-Food Trade Networks
In the Islamic Countries
15
Asia, followed by Latin America and the Caribbean. Exports in this sector are relatively
concentrated in regional terms, but once again, the distribution is relatively stable over time.
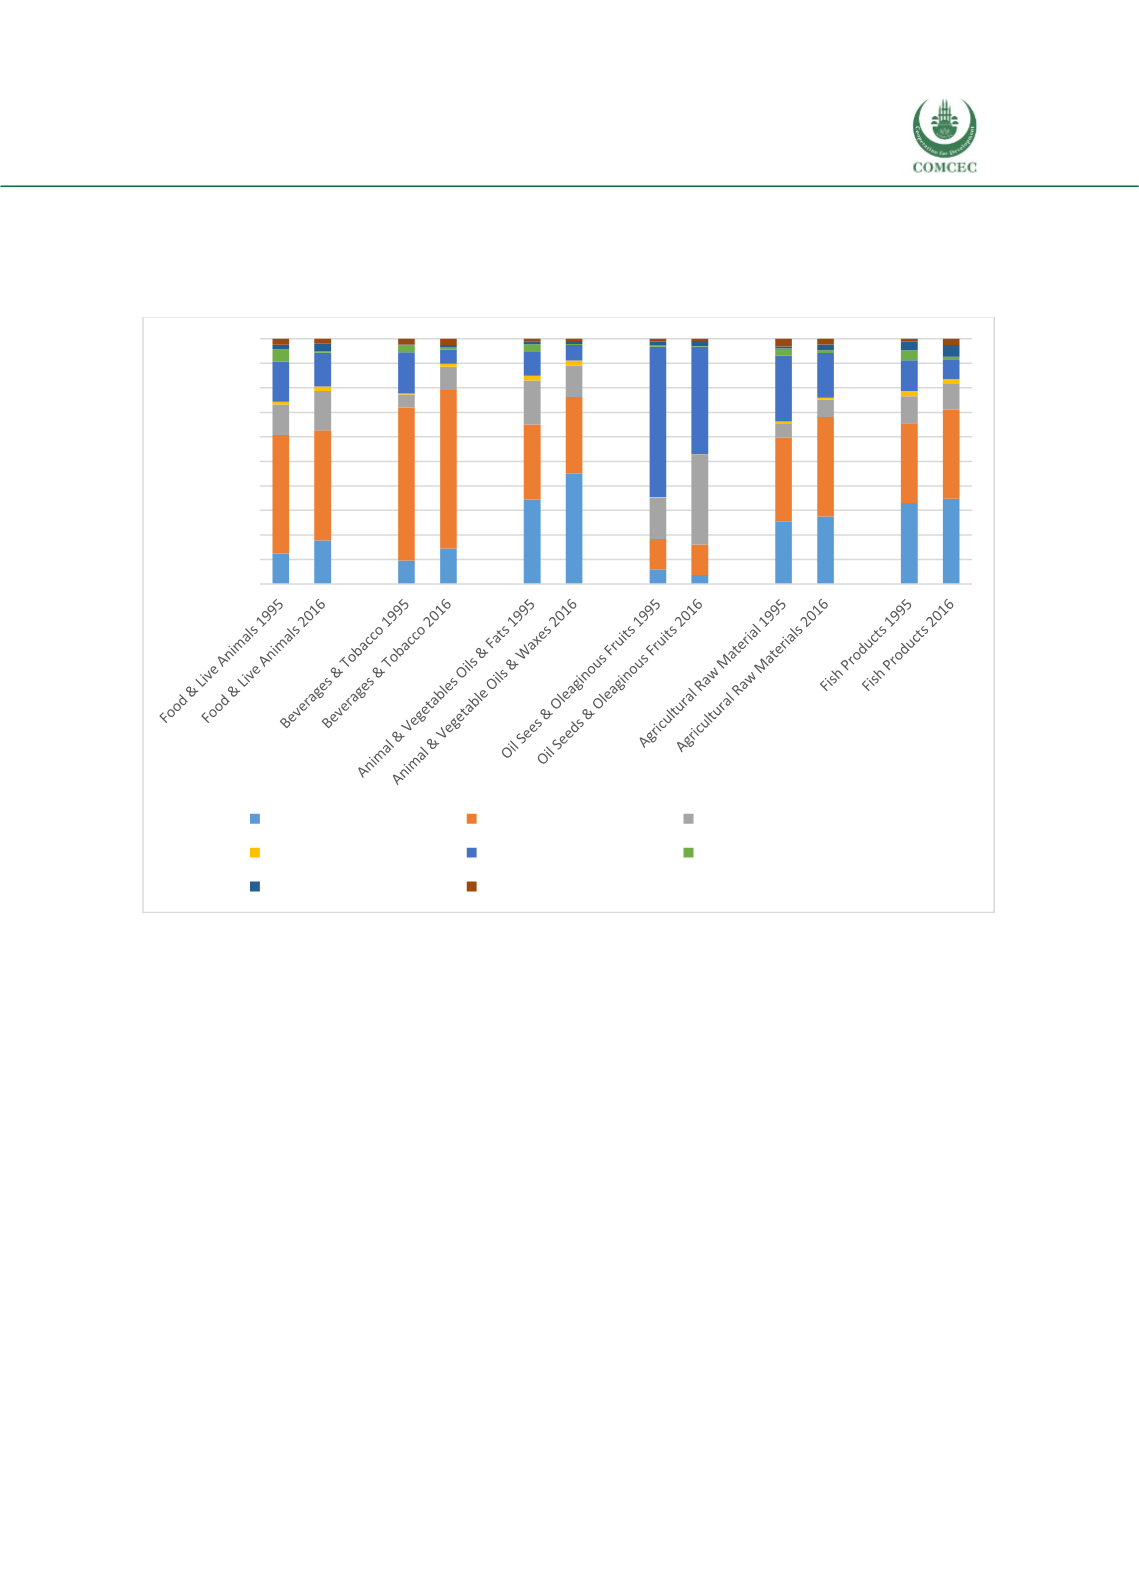
Figure 5: World Exports of Agricultural Products by Section, by Exporting Region, 1995-2016,
Percent of Total
Source
:
UN Comtrade; and Authors’ calculations.
Thus far, the focus has been on exports of agricultural products by origin. In the remainder of
this subsection, considerationmoves to the import side. Figure 6 shows the geographical pattern
of world imports of agricultural products by section, comparing 1995 and 2016 to show the
trend over time. In the first three sections, Europe and Central Asia is the dominant importing
region. However, the picture changes for oil seeds and oleaginous fruits, where East Asia and
the Pacific has become the dominant import market. With the exception of that development,
import patterns at the section level show a reasonable degree of stability over time
In agricultural raw materials, Europe and Central Asia, as well as East Asia and the Pacific, and
North America are major importers. The pattern of imports across geographical regions is
relatively stable over time, although there is clear evidence of faster import growth in East Asia
and the Pacific relative to other regions over recent years. The final section in the Annex 1
classification is fish products. In this case, the leading importers are East Asia and the Pacific,
Europe and Central Asia, and North America. As was the case for export flows, considered above,
imports in this sector are relatively concentrated in regional terms, but once again, the
distribution is relatively stable over time.
0%
10%
20%
30%
40%
50%
60%
70%
80%
90%
100%
East Asia & Pacific
Europe & Central Asia
Latin America & Caribbean
Middle East & North Africa North America
Others
South Asia
Sub-Saharan Africa


