


 21 / 152

Analysis of Agri-Food Trade Structures
To Promote Agri-Food Trade Networks
In the Islamic Countries
11
2.
OVERVIEW AND ANALYSIS OF GLOBAL AGRI-FOOD TRADE
This section provides background for the report by charting global trade patterns in agricultural
products over the last two decades. It starts by looking at the proportion of world trade
accounted for by OIC member countries, and by each of the major product groups identified in
the Annex 1 classification. Regional patterns are examined, then the text moves to consider the
direction of trade by looking at bilateral trade relationships between regions. The following
subsection takes a network analysis perspective, using graphical methods and centrality
measures to show how inter- and intra-regional trade links are important within the global
agricultural trade economy. Finally, there is a discussion of the role of global policies in
promoting trade in agricultural products over the relevant time period.
2.1.
Recent Trends in Global Agri-Food Trade
Figures 1 and 2 give an idea of the proportion of global trade accounted for by OIC countries,
differentiating between exports and imports. At this stage, OIC regional groups are not identified
separately, because the proportions would appear unduly small in the figures; the focus is on
aggregate performance at this point, before moving to a consideration of OIC regional groups in
the next section. For both exports and imports, the proportion of global trade accounted for by
intra-OIC trade is relatively small, but rising over time: in the case of exports, it increases from
6.7% in 1995 to 8.0% in 2016, while in the case of imports, it rises from 7.3% to 11.1% over the
same time period.
10
Of course, these overall figures disguise considerable variation across
regions and products, which will be examined further in this section and the next. But they
nonetheless provide a first indication that OIC countries are active in global agricultural, though
on an overall level, more as importers than as exporters.
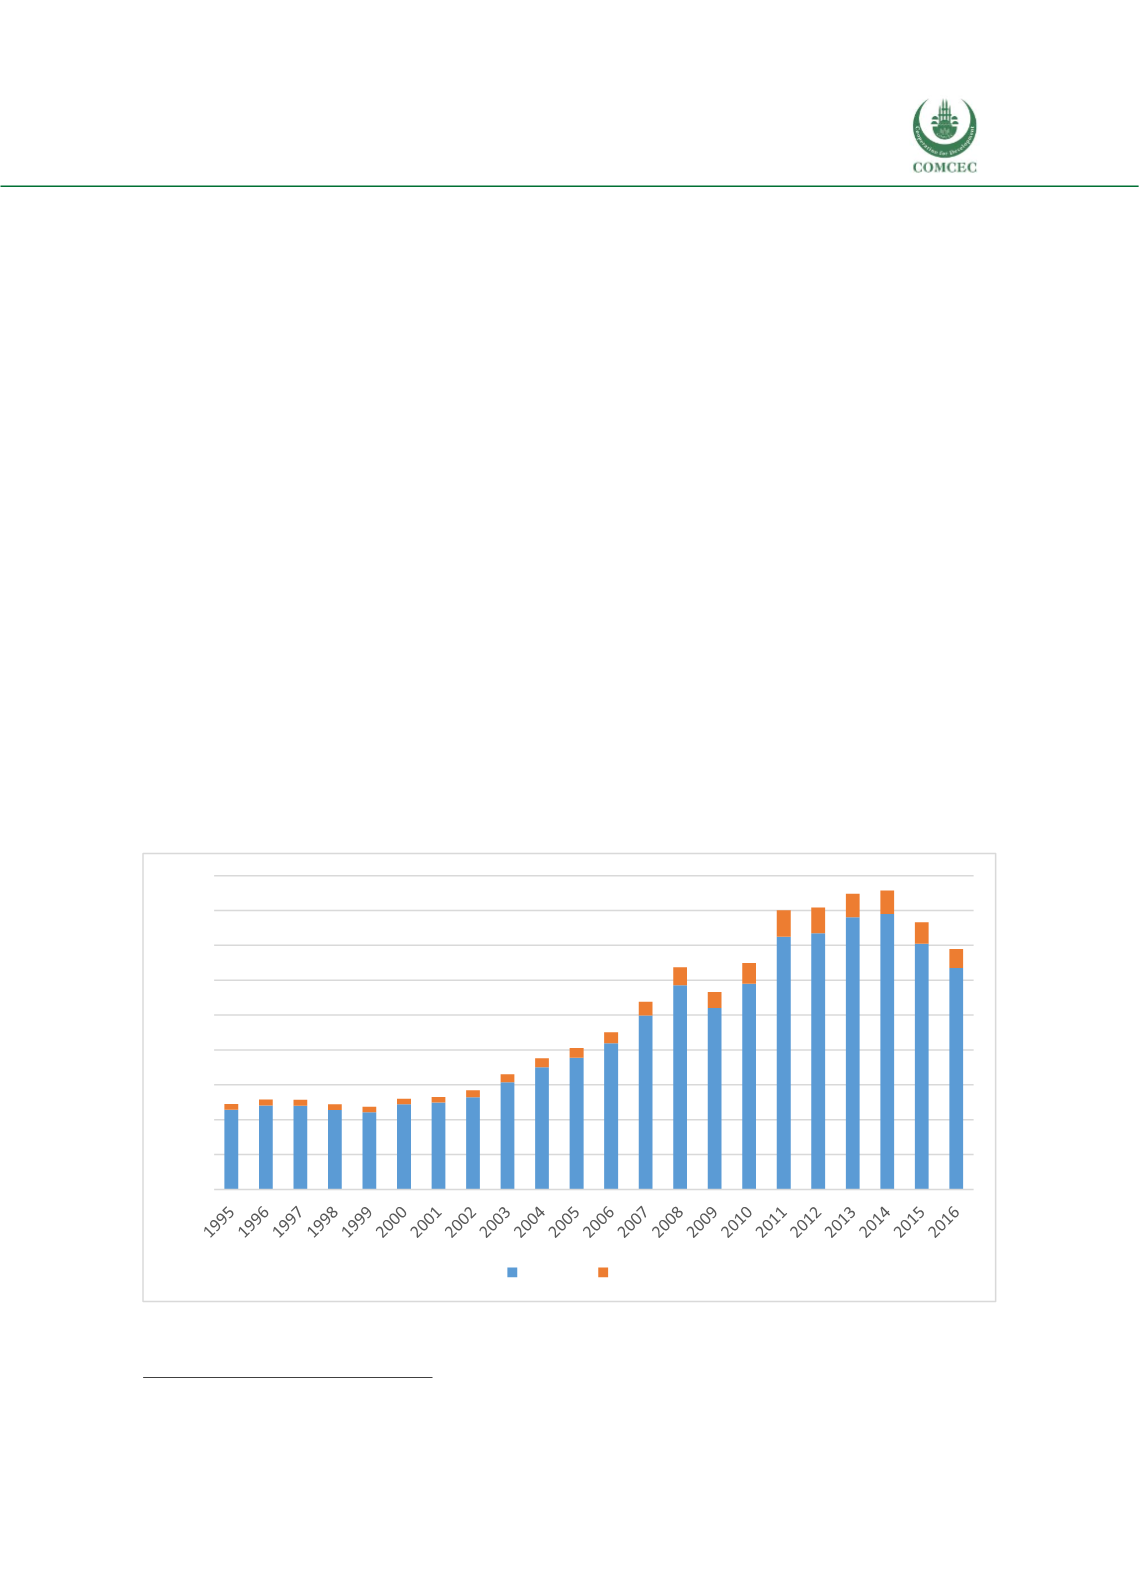
Figure 1: World Exports of Agricultural Products, 1995-2016, OIC versus Non-OIC, Billion USD
Source: UN Comtrade; and authors’ calculations.
10
Similar results are presented by COMCEC: see COMCEC Coordination Office. 2017.
COMCEC Agriculture Outlook 2017
.
Ankara: COMCEC Coordination Office.
0
200
400
600
800
1.000
1.200
1.400
1.600
1.800
Non-OIC OIC