
Improving Public Debt Management
In the OIC Member Countries
121
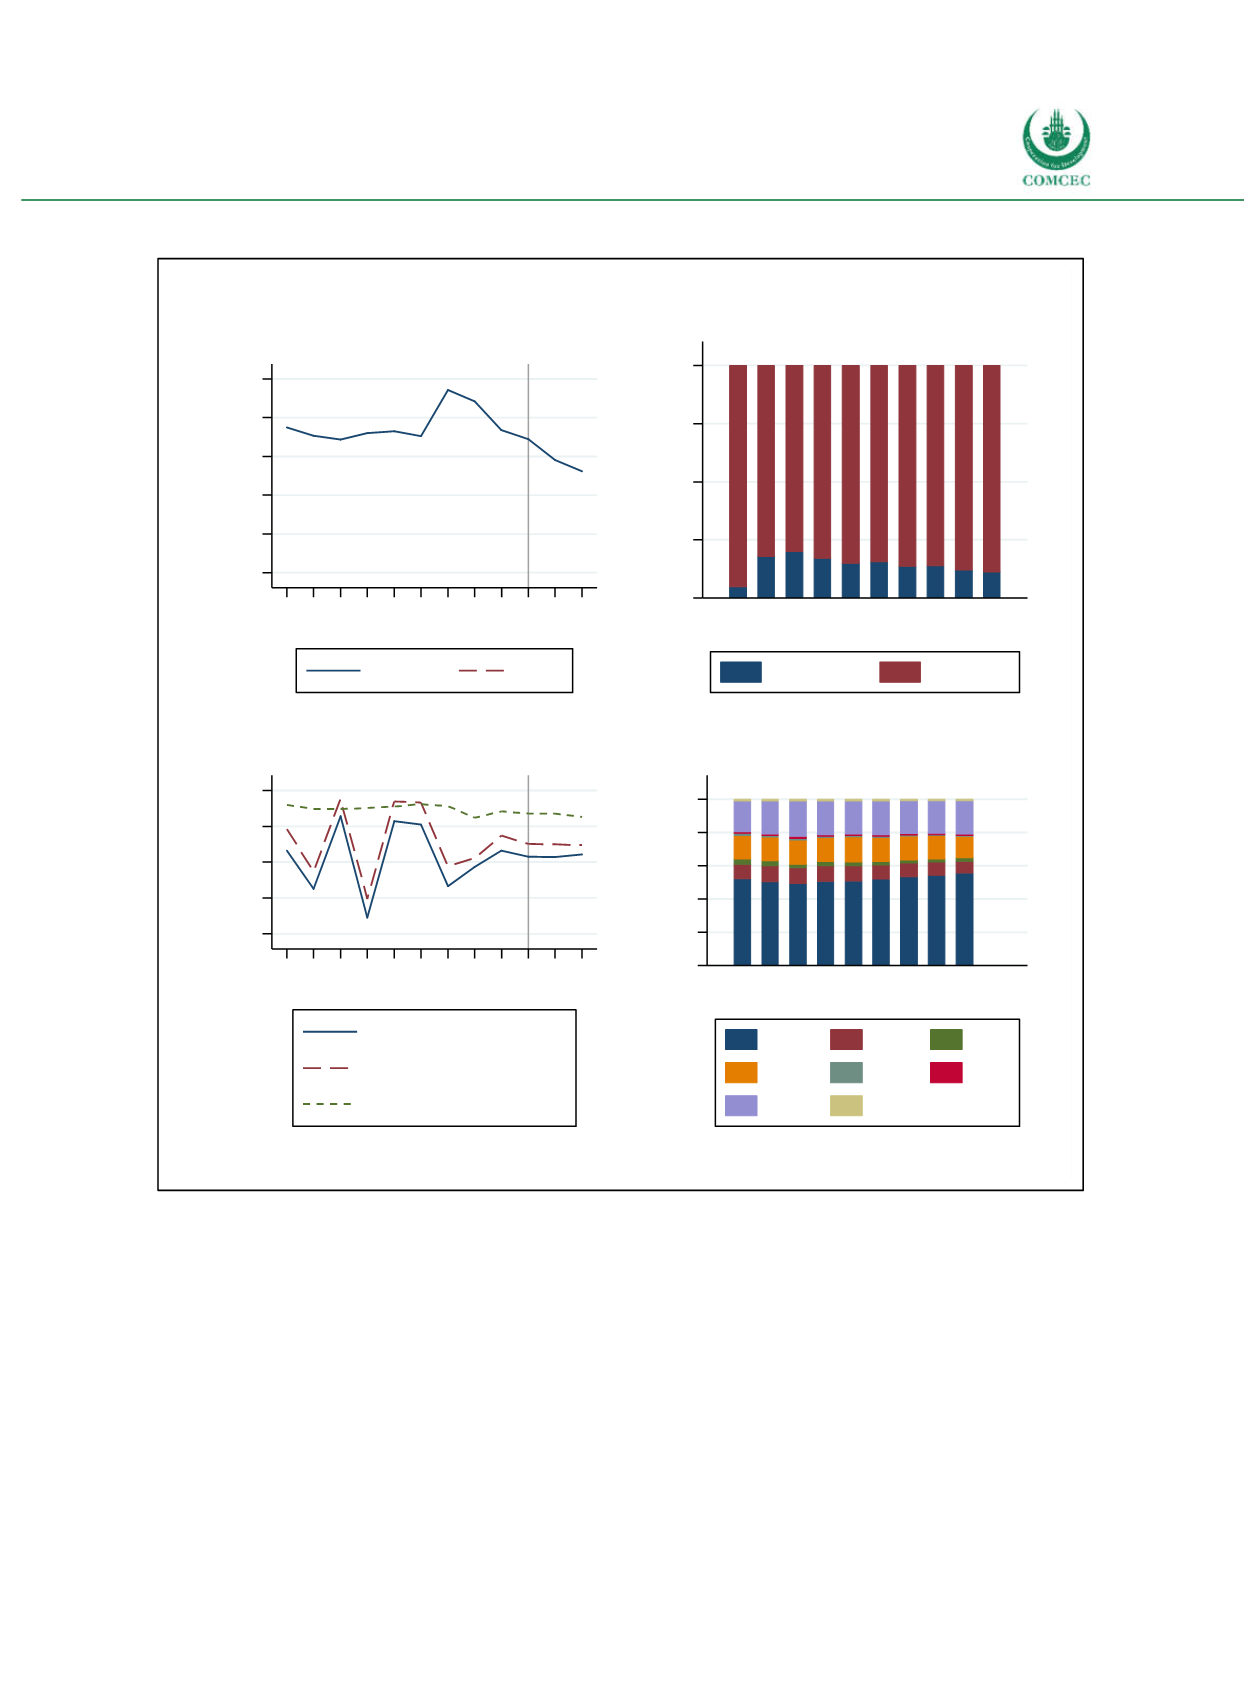
Figure 4-23: Sudan – Public Debt Dynamics
Sources: WEO (2016), IMF (2007, 2010, 2012, 2013b, 2014a, 2016a), calculations by the Ifo Institute.
Sudan’s primary budget balance fluctuated strongly between 2006 and 2012 (see Figure 423).
Major disruptions were caused by the global financial crisis, when the general government net
lending declined to 5.08% in 2009. Although there was a shortlived recovery in the following
years, the secession of South Sudan and the subsequent decline of oil revenues, down from
11.5% of GDP in 2010 to only 1.5% of GDP in 2012 (IMF 2014a), gave rise to another sharp
decline of the budget balance. Due to resolute efforts of the Sudanese government with regards
to macroeconomic stability and growth following the shock of the secession, the budget
balance improved and is expected to stabilize around 1.7% of GDP in 2015. Policy
adjustments, growth and poverty reduction programs as well as institutional reforms helped
to achieve this narrowing of fiscal deficit, which is also estimated to be relatively stable even
beyond 2015 (IMF 2016a).
0 20 40 60 80 100
% of GDP
2006
2007
2008
2009
2010
2011
2012
2013
2014
2015
2016
2017
Gross
Net
Projections
Public Debt
0
25
50
75
100
% of total public debt
2006
2007
2008
2009
2010
2011
2012
2013
2014
2015
Creditor Structure of Public Debt
Domestic
External
-6 -4 -2 0 2
% of GDP
2006
2007
2008
2009
2010
2011
2012
2013
2014
2015
2016
2017
Net lending
Primary net lending
Net interest payments
Net Lending
0 20 40 60 80 100
% of ext. public debt
2006
2007
2008
2009
2010
2011
2012
2013
2014
2015
Currency Structure of Ext. Public Debt
USD EUR GBP
CHF
JPY
Mult.
Other
SDR


