
Infrastructure Financing through Islamic
Finance in the Islamic Countries
68
472 assets damaged in the country during the war of 1992-1995 and the nationalization of
premises after 1996. The resulting loss of value is estimated at EUR 143 million (IRTI 2017:
58)
While there are no updated statistics on waqf assets in different countries, one estimate shows
that the total waqf assets in Indonesia are around USD 60 billion (IRTI 2014: 36). With a rate of
return on these assets of around 10%, this would translate to around USD 6 billion that could
be used for social welfare purposes. IRTI (2014: 36) estimates the returns to be 0.849% of the
country’s GDP in 2014. While the size of the waqf sector in various countries would be
different, an approximate figure of the returns generated by the sector can be estimated by
using the estimates for Indonesia. Given the GDP value of IDB member countries valued at USD
6.353 trillion in 2016, this translates to a return of USD 54 billion annually.
3.9.
International Initiatives
At the international level, two broad sources of Islamic finance can be identified, multilateral
development banks and Islamic infrastructure funds. Islamic Development Bank (IDB) is the
only multilateral development bank that provides Shariah-complaint project financing. The net
approvals of the total financing of IDB in its member countries since its inception in January
1976 to June 2018 are valued at USD 131.28 billion. Note that IDB project financing includes
infrastructure and other sectors such as agriculture, finance, industry and mining, public
administration, trade, real estate and other social services. The distribution of the financing to
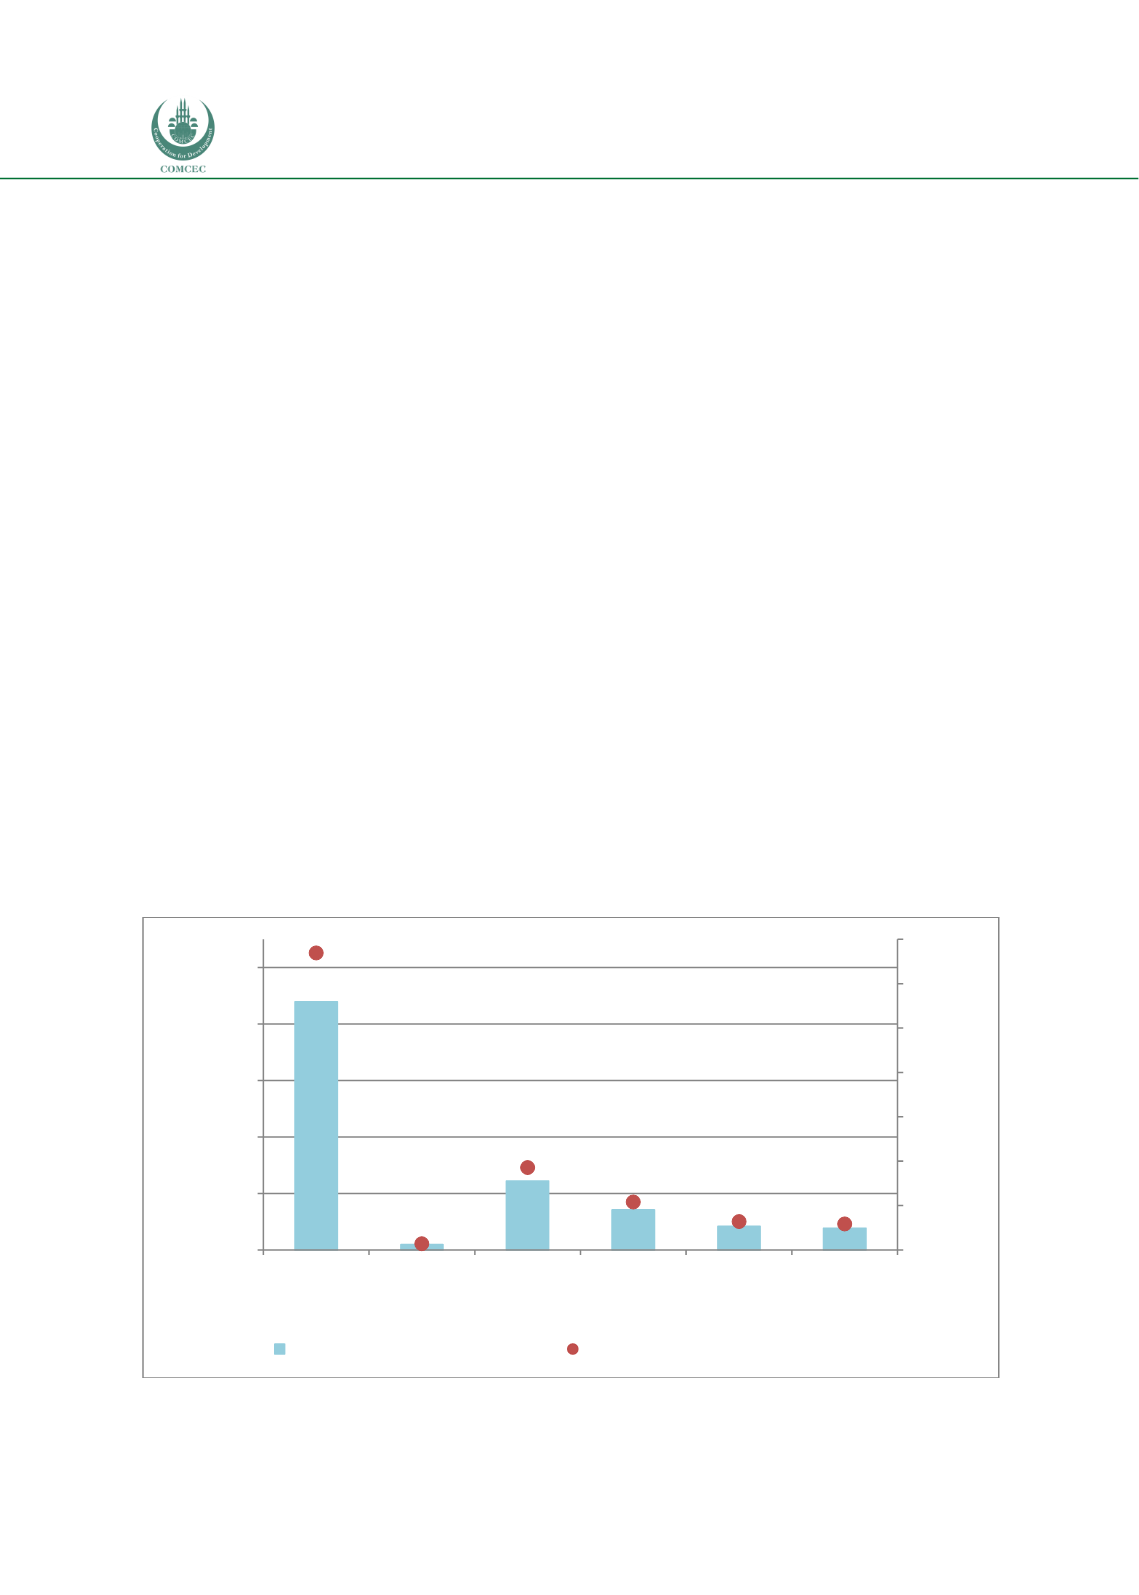
the infrastructure sector over the period 1976-2018 (Q2) is shown in Chart 3.20. During the
period, the energy sector received the largest financing with USD 43.95 billion constituting
33.5% of the total financing followed by the transportation sector with USD 12.222 billion or
9.3% of the total financing during the period. The social infrastructure sectors of education and
health received around 3% of the total financing each.
Chart 3.20: IDB Infrastructure Financing 1976-2018 (Q-2) (USD million)
Source: IDB (2018)
43,956
938
12,222
7,121
4,209
3,858
33.5%
0.7%
9.3%
5.4%
3.2%
2.9%
0%
5%
10%
15%
20%
25%
30%
35%
0
10,000
20,000
30,000
40,000
50,000
Energy Information &
Communication
Transporation Water,
Sanitation &
Urban Services
Education
Health
% of total
USD Million
IDB total financing (USD million)
IDB financing (% of infrastructure total)


