


 70 / 228

Infrastructure Financing through Islamic
Finance in the Islamic Countries
54
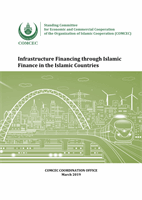
OIC countries which is lower than the average of all countries (0.33). While the OIC index is
higher than that of Low-Income and Developing Countries (0.15), it is lower than the index of
emerging markets (0.33) and advanced countries (0.64). Similar trends can be observed in the
indices of development of the financial institutions and financial markets. Between the two
sectors, the financial institutions perform better than financial markets with average indices of
0.33 and 0.13 respectively for the OIC countries.
Chart 3.7: Financial Sector Development of OIC Countries and Other Country Groupings
(2016) (0-1 Highest)
Source: IMF Financial Sector Development Database,
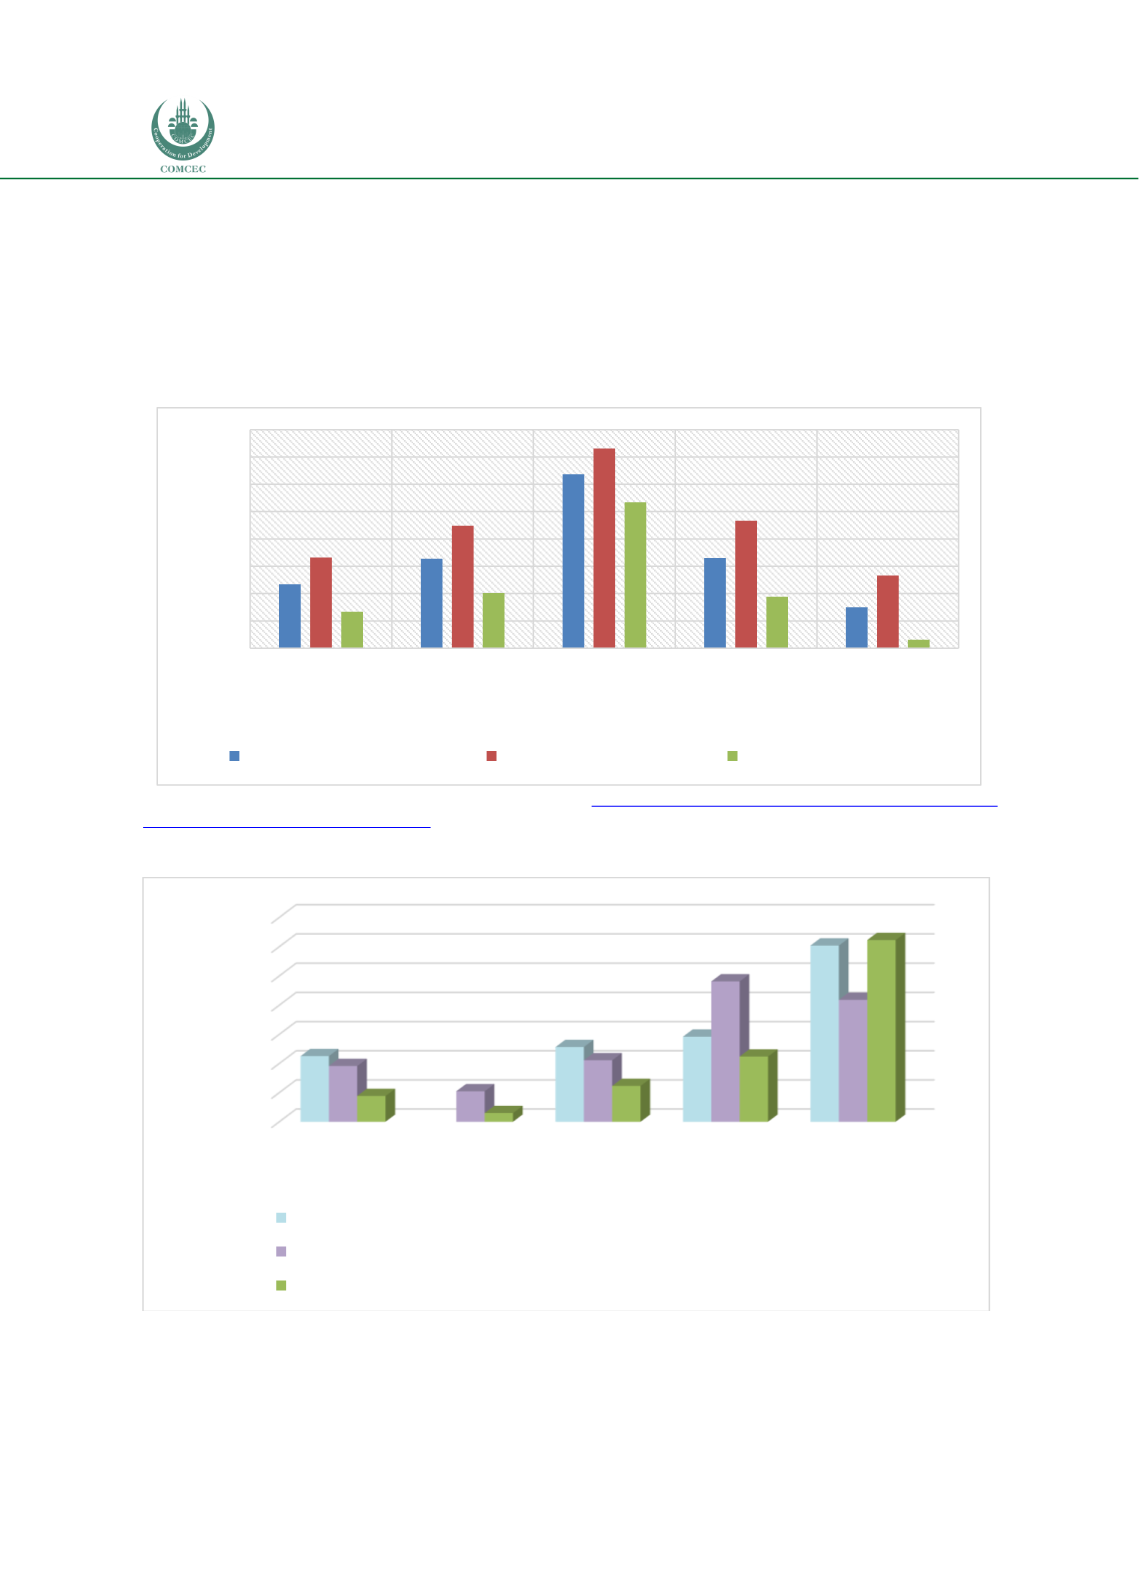
http://data.imf.org/?sk=F8032E80-B36C-43B1-AC26- 493C5B1CD33B&sId=1481126573525Chart 3.8: Relative Size of the Financial Sectors (2016) (% of GDP)
Source: World Bank Development Indicators
The relative sizes of the different financial sectors in OIC countries relative to other country
groupings for the year 2016 are shown in Chart 3.8. With no data reported for the market
0.23
0.33
0.64
0.33
0.15
0.33
0.45
0.73
0.47
0.27
0.13
0.20
0.53
0.19
0.03
0.0
0.1
0.2
0.3
0.4
0.5
0.6
0.7
0.8
OIC Average
All Countries Advanced Markets Emerging Markets Low-Income and
Developing
Countries
Index (0-1Highest)
Financial Development Index
Financial Institutions Index
Financial Markets Index
0
20
40
60
80
100
120
140
OIC Average Low income Lower middle
income
Middle income High income
45.1
51.3
58.4
120.8
38.3
21.0
42.2
96.3
83.6
17.7
6.0
24.6
44.8
124.5
% of GDP
Market capitalization of listed domestic companies (% of GDP)
Domestic credit to private sector by banks (% of GDP)
Domestic credit to private sector by non-bank financial institutions (% of GDP)