
Infrastructure Financing through Islamic
Finance in the Islamic Countries
142
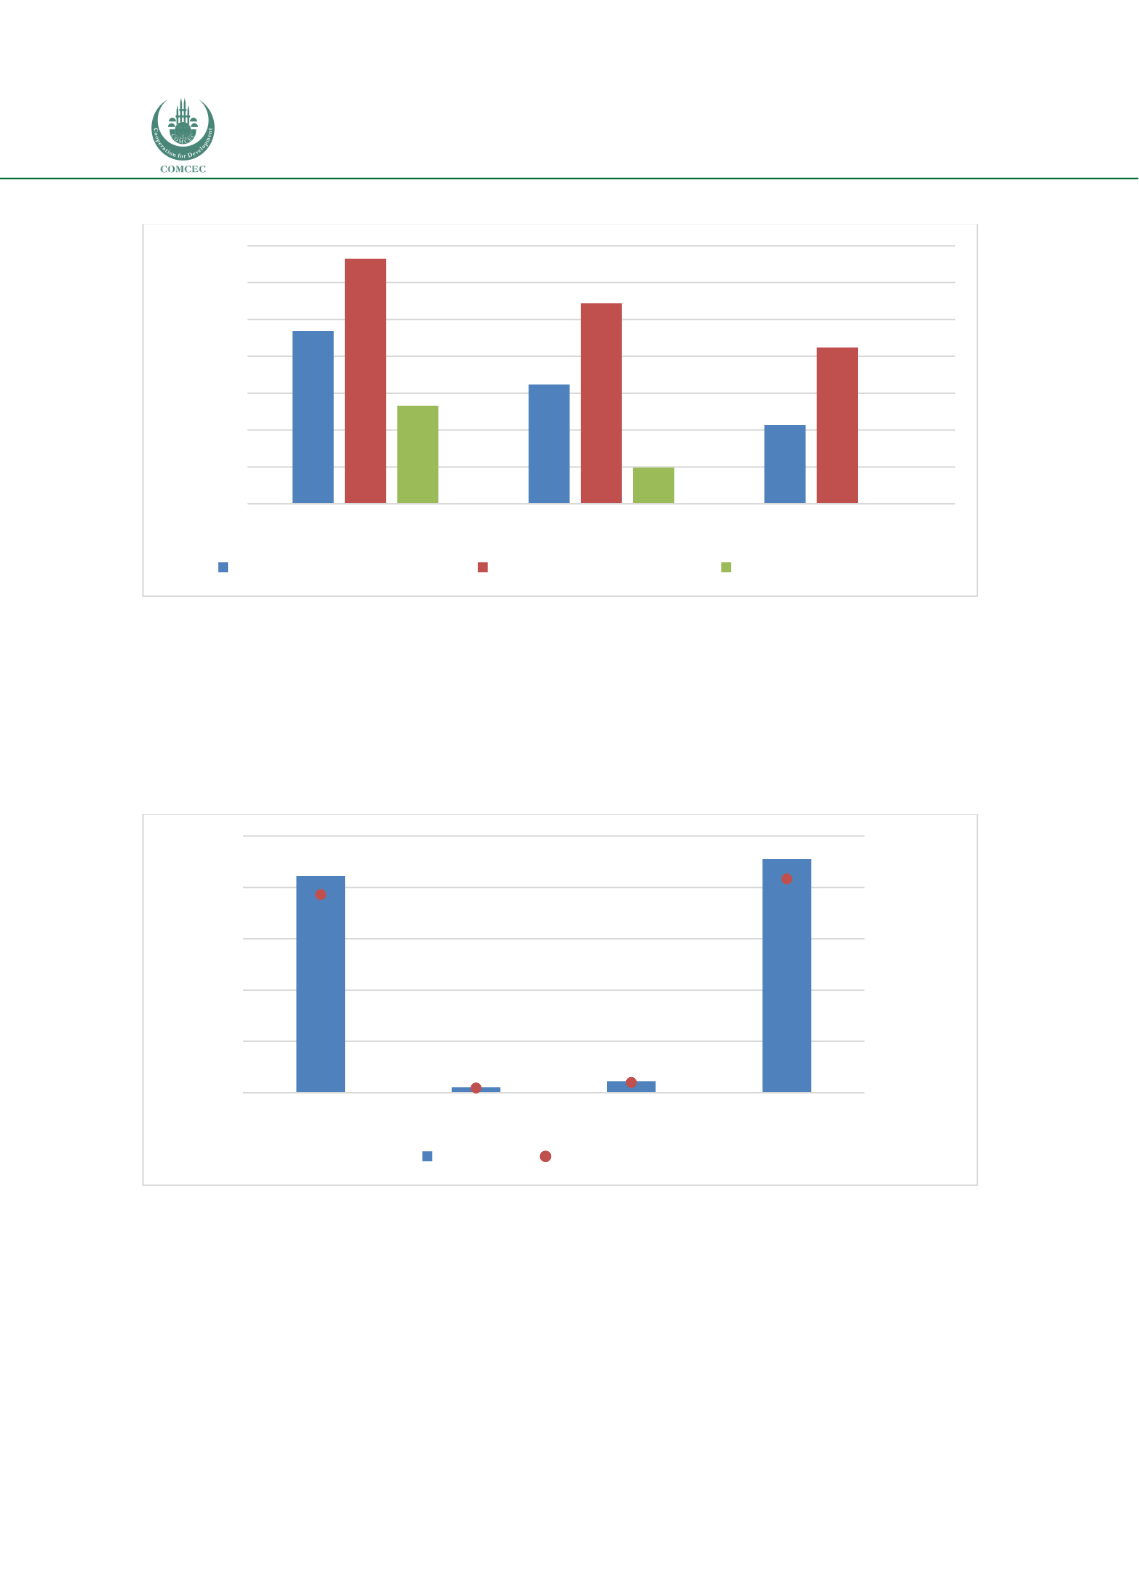
Chart 4.5. 1: Relative Financial Sector Development in Sudan (2016) (0-1 Highest)
Source: IMF Financial Sector Development Database
Chart 4.5.2 shows the composition of the Sudanese financial sector including banks, insurance
companies and capital market value. The financial sector is dominated by banks with assets
worth SDG 211.2 billion (USD 11.765 billion), representing 92.8% of the total size of Sudan’s
financial sector. The total Islamic banking assets of 37 specialized, commercial, banks in Sudan
increased by 10.5% from USD 10.651 in 2014 to USD 11.765 billion in 2017 (CBOS, 2017).
Chart 4.5. 2: Islamic Financial Sector Composition Sudan (2017) (SDG billion)
Source: (CBOS, 2017) & (KSE, 2017 & (Insurance Companies consolidated balance sheet, 2017)
The capital markets that include the stock market, Sukuk, and investment funds market is
valued at SDG 11.2 billion (UD$ 625.84 million) and represents 4.9% out of the total size of the
financial sector. The capital market, however, is dominated by sukuk valued at SDG 10.396
billion (USD 578 million), representing 92.5% of the capital markets, and the remaining 7.48%,
constituting stock market capitalization of SDG 841 million (USD 46.84 million). Furthermore,
trading in sukuk in KSE is dominated by Government Musharakah Certificates (GMCs), which
represent approximately 80% of their traded value (KSE, 2014).
0.23
0.16
0.11
0.33
0.27
0.21
0.13
0.05
0.00
0.00
0.05
0.10
0.15
0.20
0.25
0.30
0.35
OIC Average
Africa
Sudan
Index Value (0-1 Highest)
Financial Development Index
Financial Institutions Index
Financial Markets Index
211.25
5.24
11.24
227.72
92.8%
2.3%
4.9%
100.0%
0%
20%
40%
60%
80%
100%
120%
0
50
100
150
200
250
Bank Assets
Insurance Assets Capital Market Value Total Assets
% of total
SDG Billion
SDG Billion % of overall industry


