


 62 / 143

COMCEC Transport and Communications
Outlook 2019
42
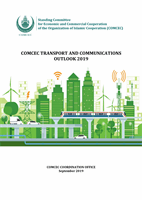
Figure 22: Road sector energy consumption and income per capita in OIC countries
Source: Author from the World Bank World Development Indicators
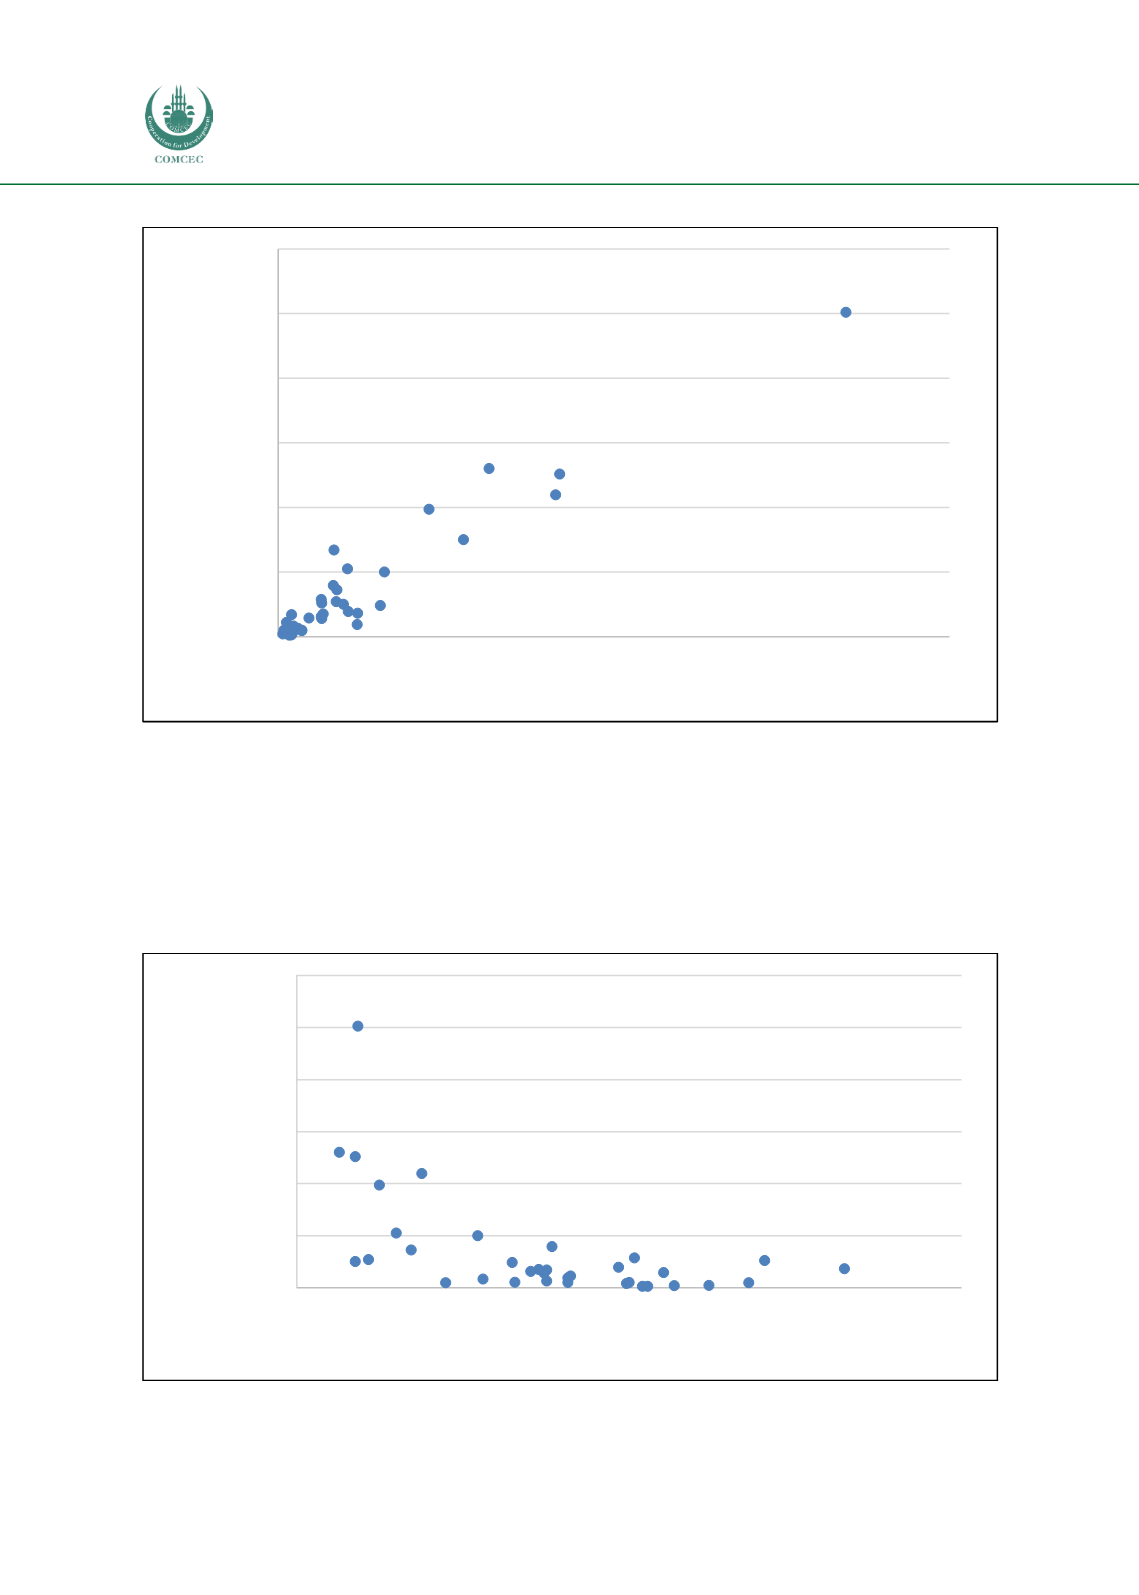
The pump price for gasoline is also a major determinant for road sector GHG emissions. Figure
23 shows that a negative relation exists between pump price for gasoline and road sector energy
consumption in 35 OIC countries in 2011 (which can be used as a proxy for GHG emissions).
Figure 23: Road sector energy consumption per capita and pump price for gasoline in the
OIC Member States (2014)
Source: Author from the World Bank World Development Indicators
Albania Algeria
Bahrain
Cameroon
Egypt, Arab Rep.
Indonesia
Iran, Islamic Rep.
Iraq
Jordan
Kuwait
Lebanon
Libya
Oman
Qatar
Saudi Arabia
UAE
Yemen, Rep.
-
500
1.000
1.500
2.000
2.500
3.000
-
20.000 40.000 60.000 80.000 100.000 120.000 140.000 160.000
Road sector energy consumption per
capita (kg of oil equivalent) (2011)
GDP per capita (2015), PPP (constant 2011 $)
Albania
Algeria
Azerbaijan
Bangladesh
Gabon
Iran
Iraq
Jordan
Kazakhstan
Kuwait
Lebanon
Malaysia
Mozambique
Nigeria
Oman
Qatar
Saudi Arabia
Turkey
Turkmenistan
UAE
Yemen, Rep.
-
500
1.000
1.500
2.000
2.500
3.000
0
0,5
1
1,5
2
2,5
Road sector energy consumption
per capita (kg of oil equivalent)
Pump price for gasoline (US$ per liter)