


 58 / 143

COMCEC Transport and Communications
Outlook 2019
38
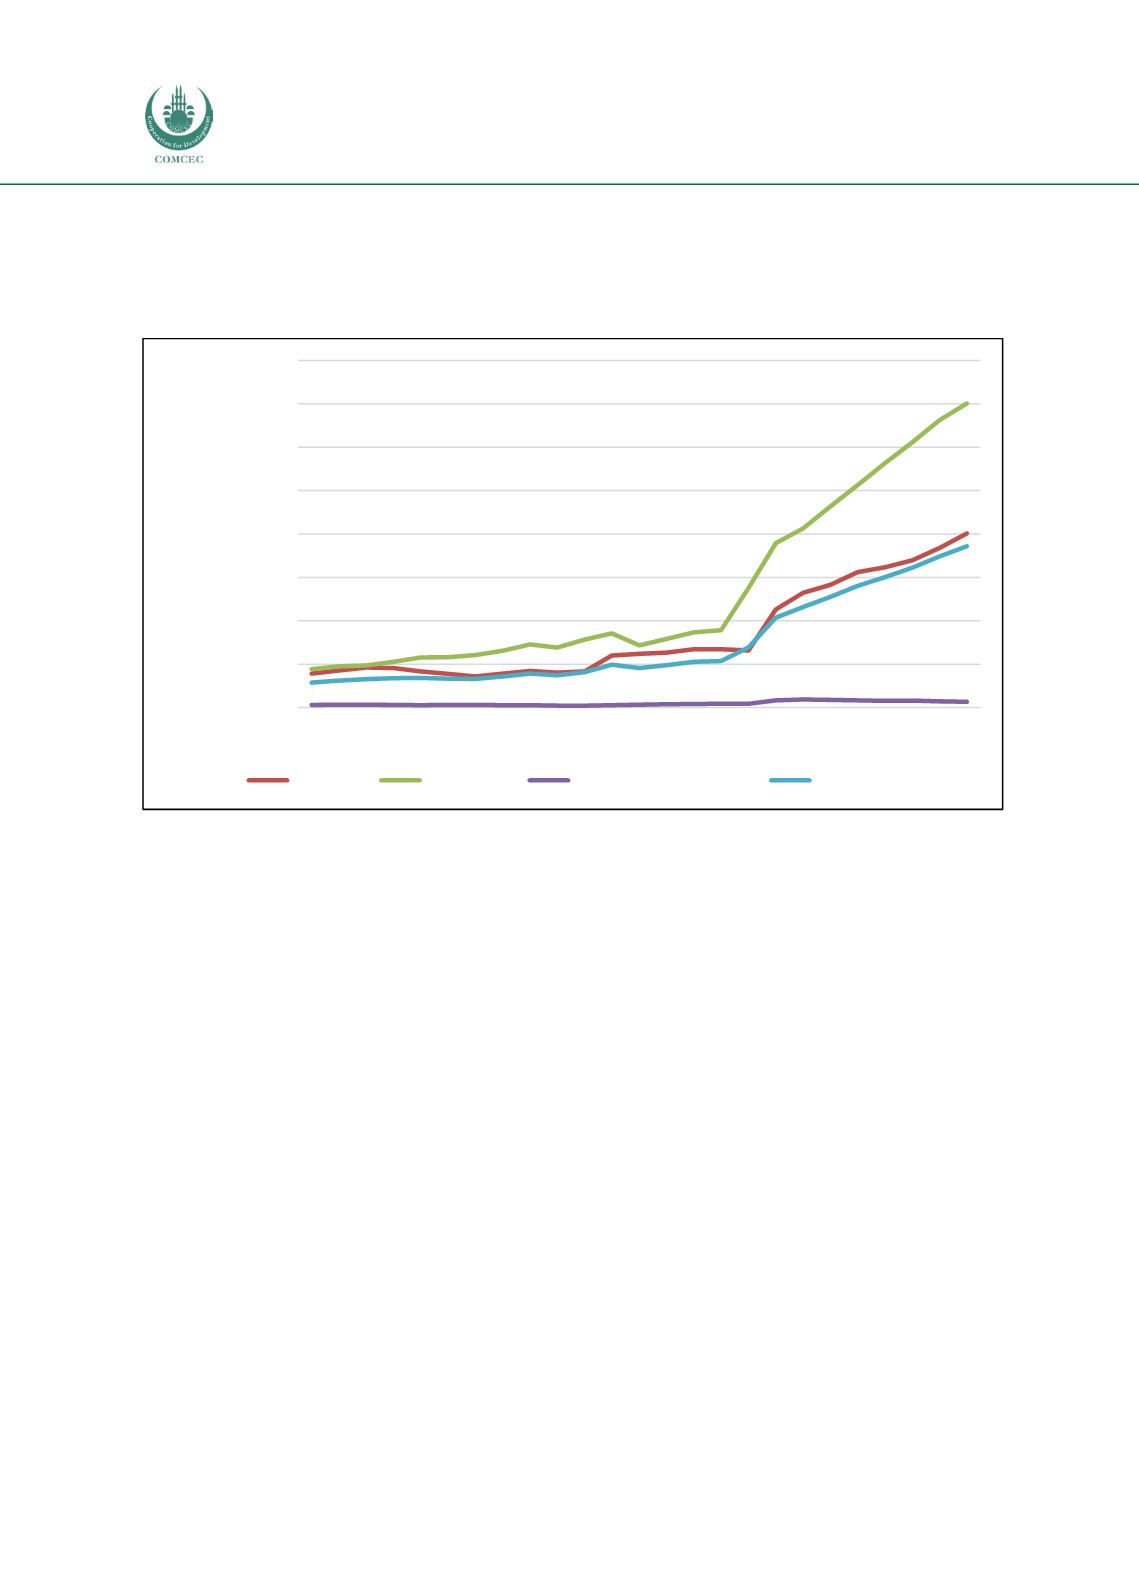
Regarding the number of air passengers throughout the 1993-2017 period, Figure 17 reveals
that OIC-MENA outperformed other regions since 1993 while OIC-Sub-Saharan Africa remained
well below the other regions during this period.
Figure 17: Total air passengers carried in the OIC regions (1993-2017)
Source: Author from the World Bank World Development Indicators
In general, more populous countries tend to have higher air passenger traffic. In addition, the
income level, geographical position and the availability of alternative transport modes affect the
level of air passenger traffic in that country. For example, higher per capita income countries are
more likely to have higher per capita air passenger traffic. Similarly, it is possible to observe that
island countries where surface transport linkages are quite limited have higher per capita air
passenger traffic figures. To analyse the linkage between population and air passenger
movements for the OIC Member States, the air passenger movements of the member states were
normalized with their populations. In this regard, Table 14 presenting the ratios of air
passengers carried to the populations of each member state has several implications. Firstly, in
parallel to the theory, the high income gulf countries such as Qatar, UAE, and Bahrain and island
states like Brunei Darussalam and Malaysia have higher per capita air passenger traffic figures.
Secondly, the OIC countries with dominant network airlines are more likely to experience higher
per capita air passenger traffic. Thanks to their well-established hub-and-spoke system, large
network airlines such as Turkish Airlines and Emirates can achieve higher economies of scale
and thus enjoy higher per capita air passenger traffic.
0
50000000
100000000
150000000
200000000
250000000
300000000
350000000
400000000
1993
1994
1995
1996
1997
1998
1999
2000
2001
2002
2003
2004
2005
2006
2007
2008
2009
2010
2011
2012
2013
2014
2015
2016
2017
Air passengers carried
OIC Asia
OIC MENA
OIC Sub-Saharan Africa
OIC Average