


 61 / 143

COMCEC Transport and Communications
Outlook 2019
41
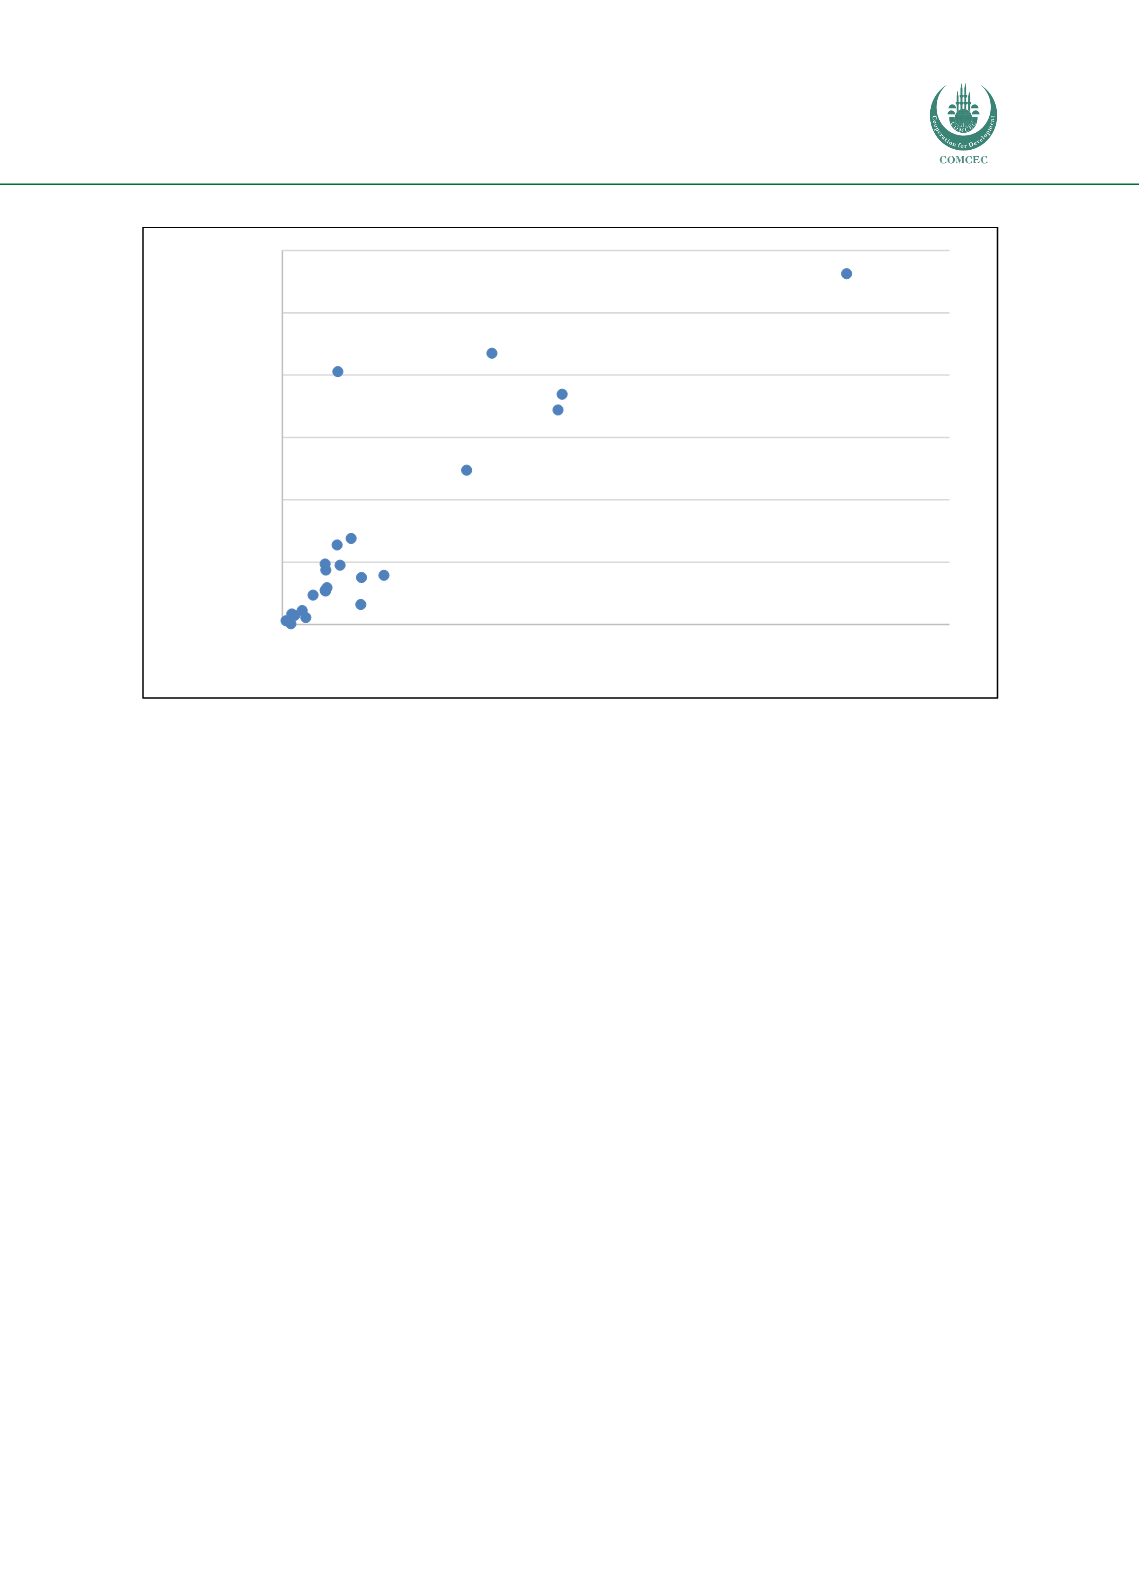
Figure 21: Transport CO
2
emissions and GDP per capita (PPP) in OIC Countries (2014)
Source: Author from World Energy Council
Further analysis on road passenger transportation regarding the linkage between transport and
environment is necessary for two reasons. Firstly, road transport accounts for almost three-
quarter of all transport GHG emissions and passenger transportation is the determinant factor.
Secondly, available data generally lack comparable statistics on road freight transport but cover
road passenger transport statistics.
As noted earlier above, higher per capita income countries tend to emit more GHG per capita
and this generalization is valid for the transport GHG emissions as well. Although several other
factors, such as existing road infrastructure, alternative public transport opportunities, existing
parking policies, personal security concerns, and the urban sprawl, are also influential; the
personal income and the prices of the fuels are the two major determinants (in addition to car
prices) for private car ownership and use. To begin with ‘per capita income’, Figure 22, which
depicts the change in road sector energy consumption per capita with respect to per capita
income, shows the comparable relation for 37 OIC countries. As the figure suggests, the OIC
countries with higher per capita income are more likely to consume more road sector energy
per capita. The top OIC countries (i.e. Qatar, Kuwait, UAE, Saudi Arabia Oman, and Bahrain) with
highest per capita income are also the top road sector energy consumers per capita.
Bahrain
Chad
Egypt
Gabon
Iran
Jordan
Kazakhstan
Kuwait
Lebanon
Libya
Morocco
Nigeria Pakistan
Qatar
Saudi Arabia
Senegal
Tunisia
UAE
-
1.000
2.000
3.000
4.000
5.000
6.000
-
20.000 40.000 60.000 80.000 100.000 120.000 140.000 160.000
Transport Emissions per capita
(tonnes CO
2
/ 1,000 capita)
GDP per capita (PPP) in US dollar (2011 prices)