


 60 / 143

COMCEC Transport and Communications
Outlook 2019
40
4.
ENVIRONMENTAL EFFECTS OF TRANSPORT SECTOR
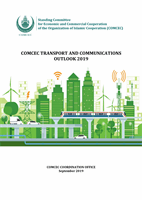
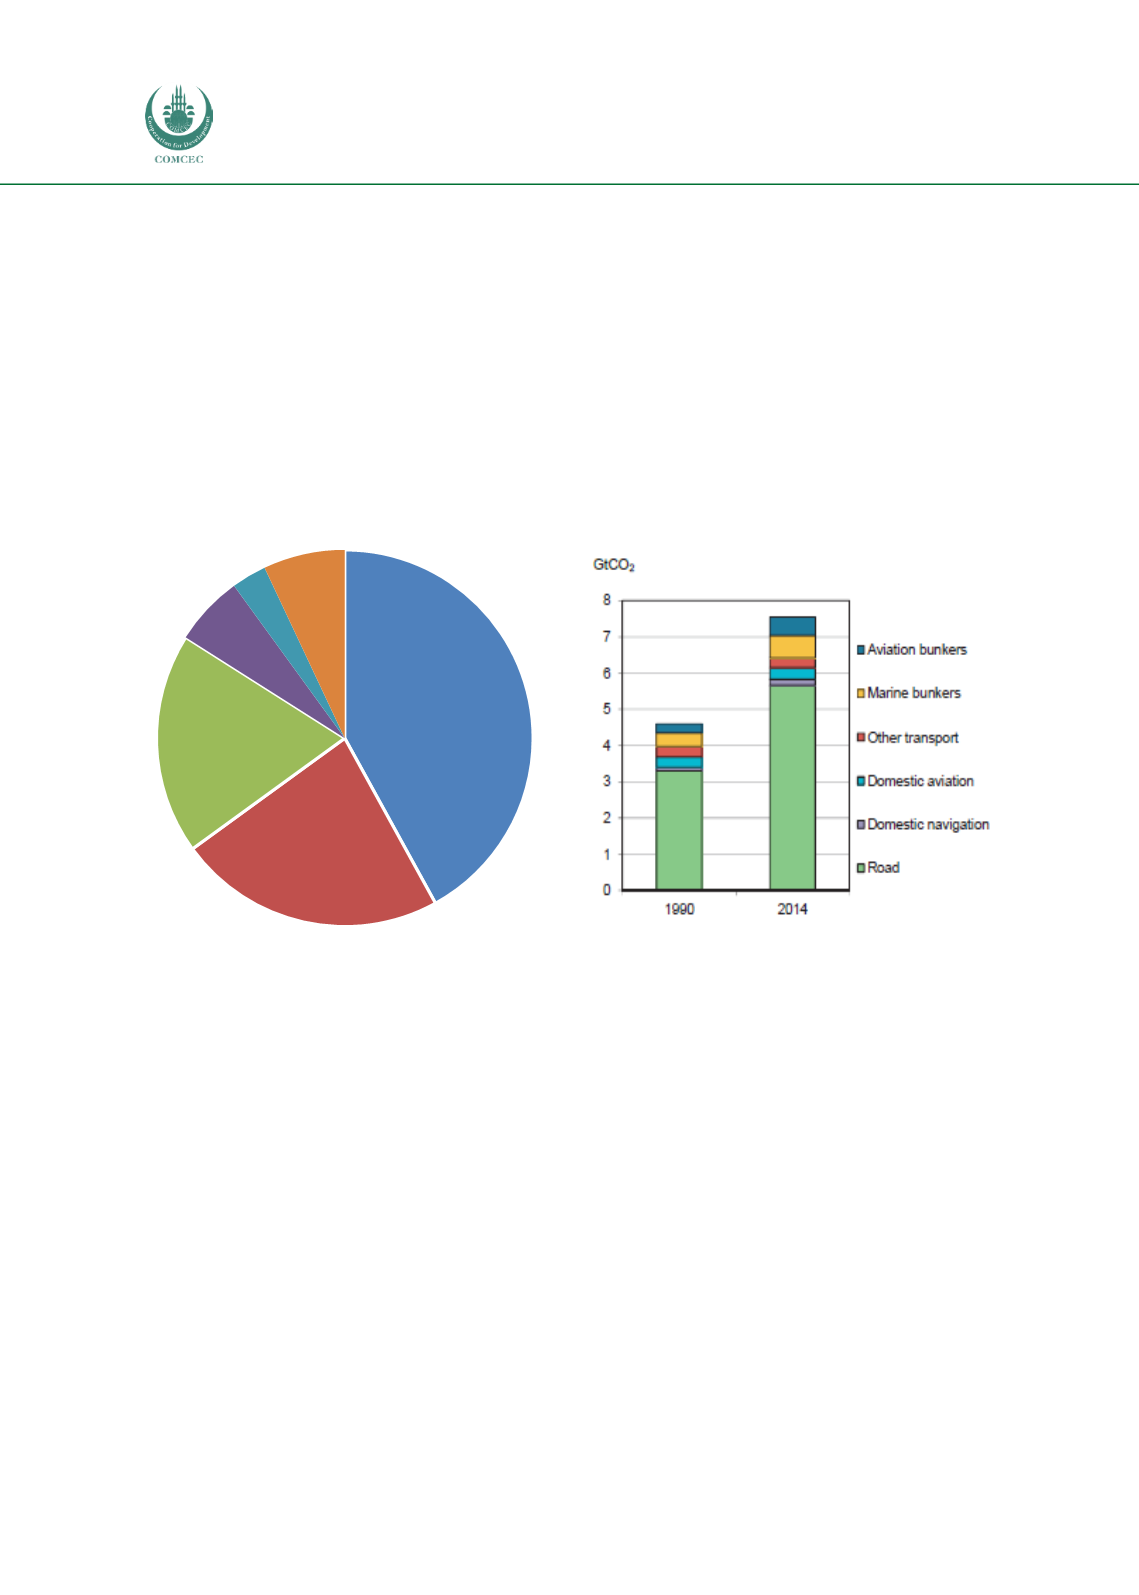
Transport emissions have been rising over time in parallel with the increase in transport
demand. As Figure 19 shows, with regard to CO
2
, the most emitted GHG, transportation
accounted for 23% of global CO
2
emissions, which makes it the second largest CO
2
emitter,
proceeded by electricity and heat generation (42%) and followed by industry (19%) in 2014
(OECD/IEA, 2016). Figure 20 reveals that with regard to international trade related CO
2
emissions by transportation mode, road transportation dominates CO
2
emissions by 53% and it
is followed by maritime transport (37%), air transport (7%), and rail transport (3%).
Figure 19: World CO
2
emissions by sector
(2014)
Figure 20: International trade related CO
2
emissions by mode (2014)
Source: OECD/IEA (2016)
Source: OECD/IEA (2016)
Though it is likely to observe some variations depending on the domestic fuel prices and the
availability of alternative energy sources, higher per capita income countries tend to emit more
GHG per capita. Figure 21 shows that there is a positive correlation between transport-related
CO
2
emissions and GDP per capita (PPP) in the OIC countries. One reason for this tendency is the
increased private car ownership with increasing per capita income, which eventually increases
personal trips and accordingly GHG emissions. Another implication of the figure is that the
countries with higher GHG emissions are mostly from oil producing countries, which often
corresponds to lower pump prices for gasoline and consequently more road sector energy
consumption.
Electricity and heat
generation
42%
Transport
23%
Industry
19%
Residential
6%
Services
3%
Other
7%