


 68 / 143

COMCEC Transport and Communications
Outlook 2019
48
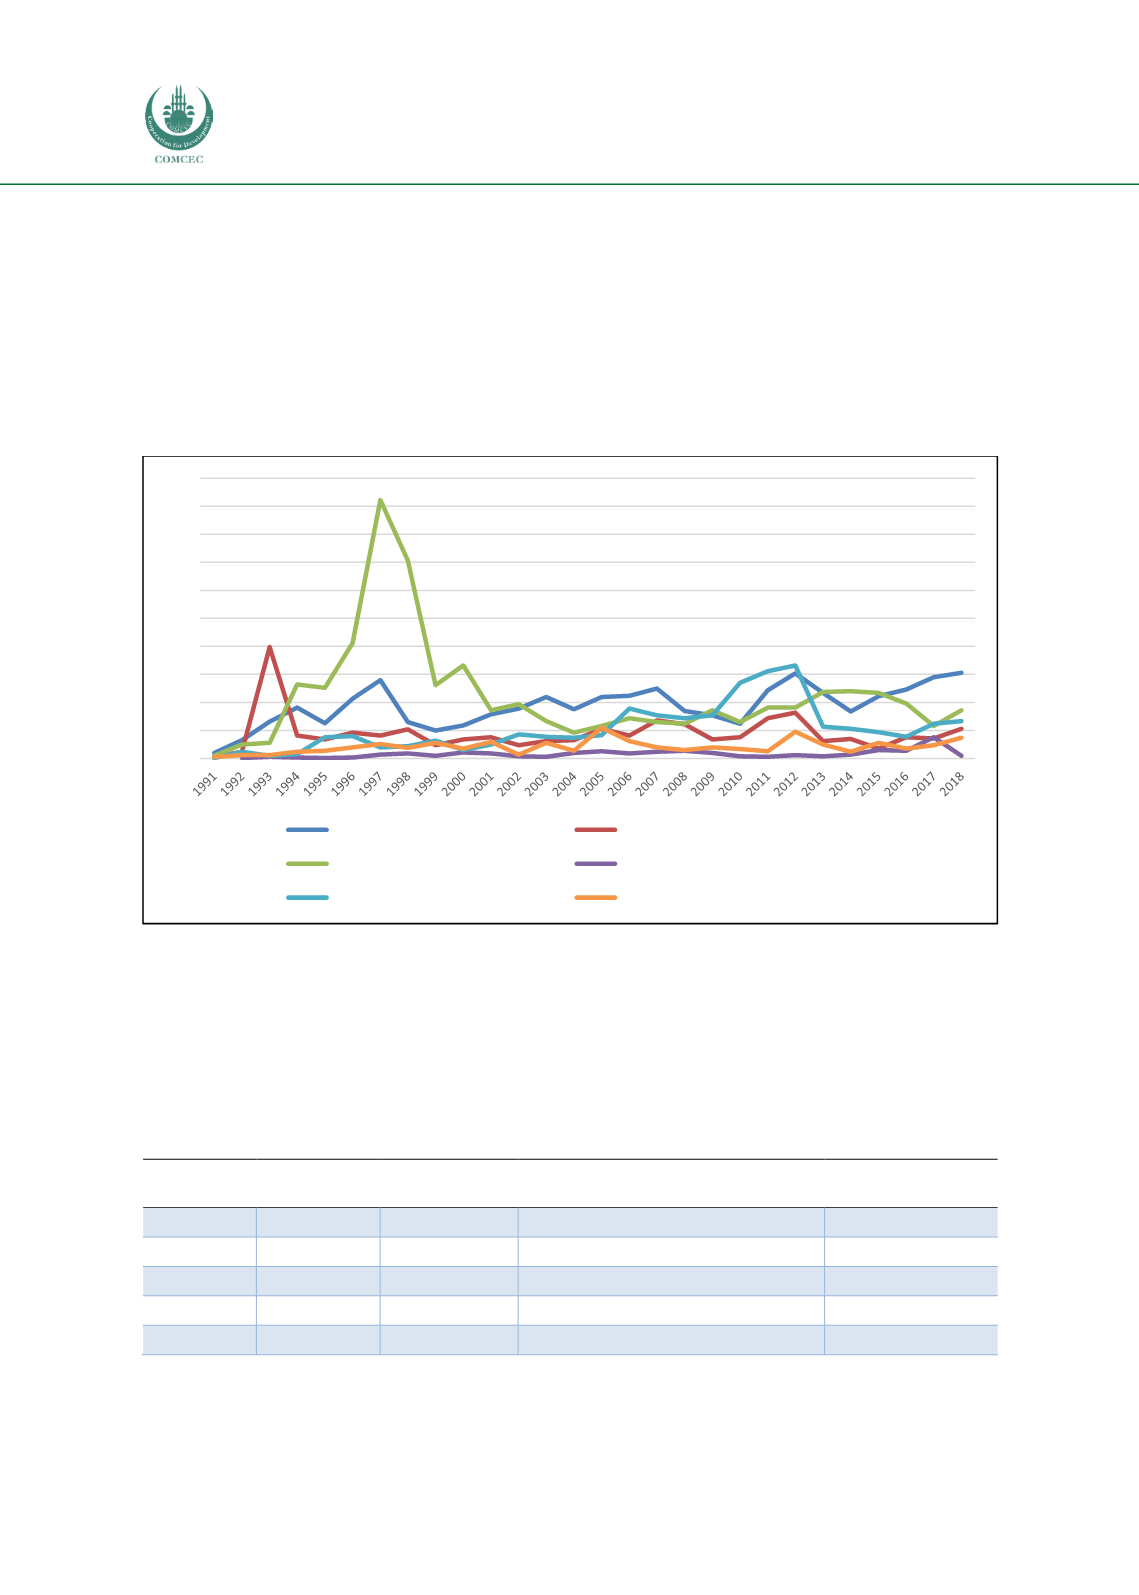
The changes in the number of transport PPI projects by geographic regions in the 1991-2018
period are presented in Figure 26. In terms of using PPI models in transport projects, South Asia
- with an increasing trend in recent years - and Latin America and the Caribbean are the two
best performing regions whereas Middle East and North Africa and Sub-Saharan Africa
remained at the bottom of the figure. Another interesting feature of the figure is its fluctuant
pattern as a result of regional and global crises which proves that PPI/PPP implementation has
been quite sensitive to economic stability.
Figure 26: Changes in the number of transport PPI projects by regions (1991-2018)
Source: Author from the World Bank PPI Database
With respect to the distribution of transport PPI projects by modes, for roads the PPI projects
outnumbered others with a share of 51.5.4% while seaports, railroads, and airports had the
shares of 27.3%, 11.7%, and 9.4%, respectively. Table 17 provides the global transport PPI
project counts and their respective shares with regard to transport modes.
Table 16: Distribution of global transport PPI projects by modes (1991-2018)
Subsector
Project
Count
% Project
Count
Total Investment
Commitments (billion $)
% Total
Investment
Airports
202
9.4%
106.6
17%
Railroads
251
11.7%
115.7
19%
Roads
1103
51.5%
313.4
50%
Seaports
584
27.3%
85.8
14%
Total
2140
100.0%
621.5
100%
Source: Author from the World Bank PPI Database
0
50
100
150
200
250
300
350
400
450
500
East Asia and Pacific
Europe and Central Asia
Latin America and the Caribbean
Middle East and North Africa
South Asia
Sub-Saharan Africa