


 55 / 143

COMCEC Transport and Communications
Outlook 2019
35
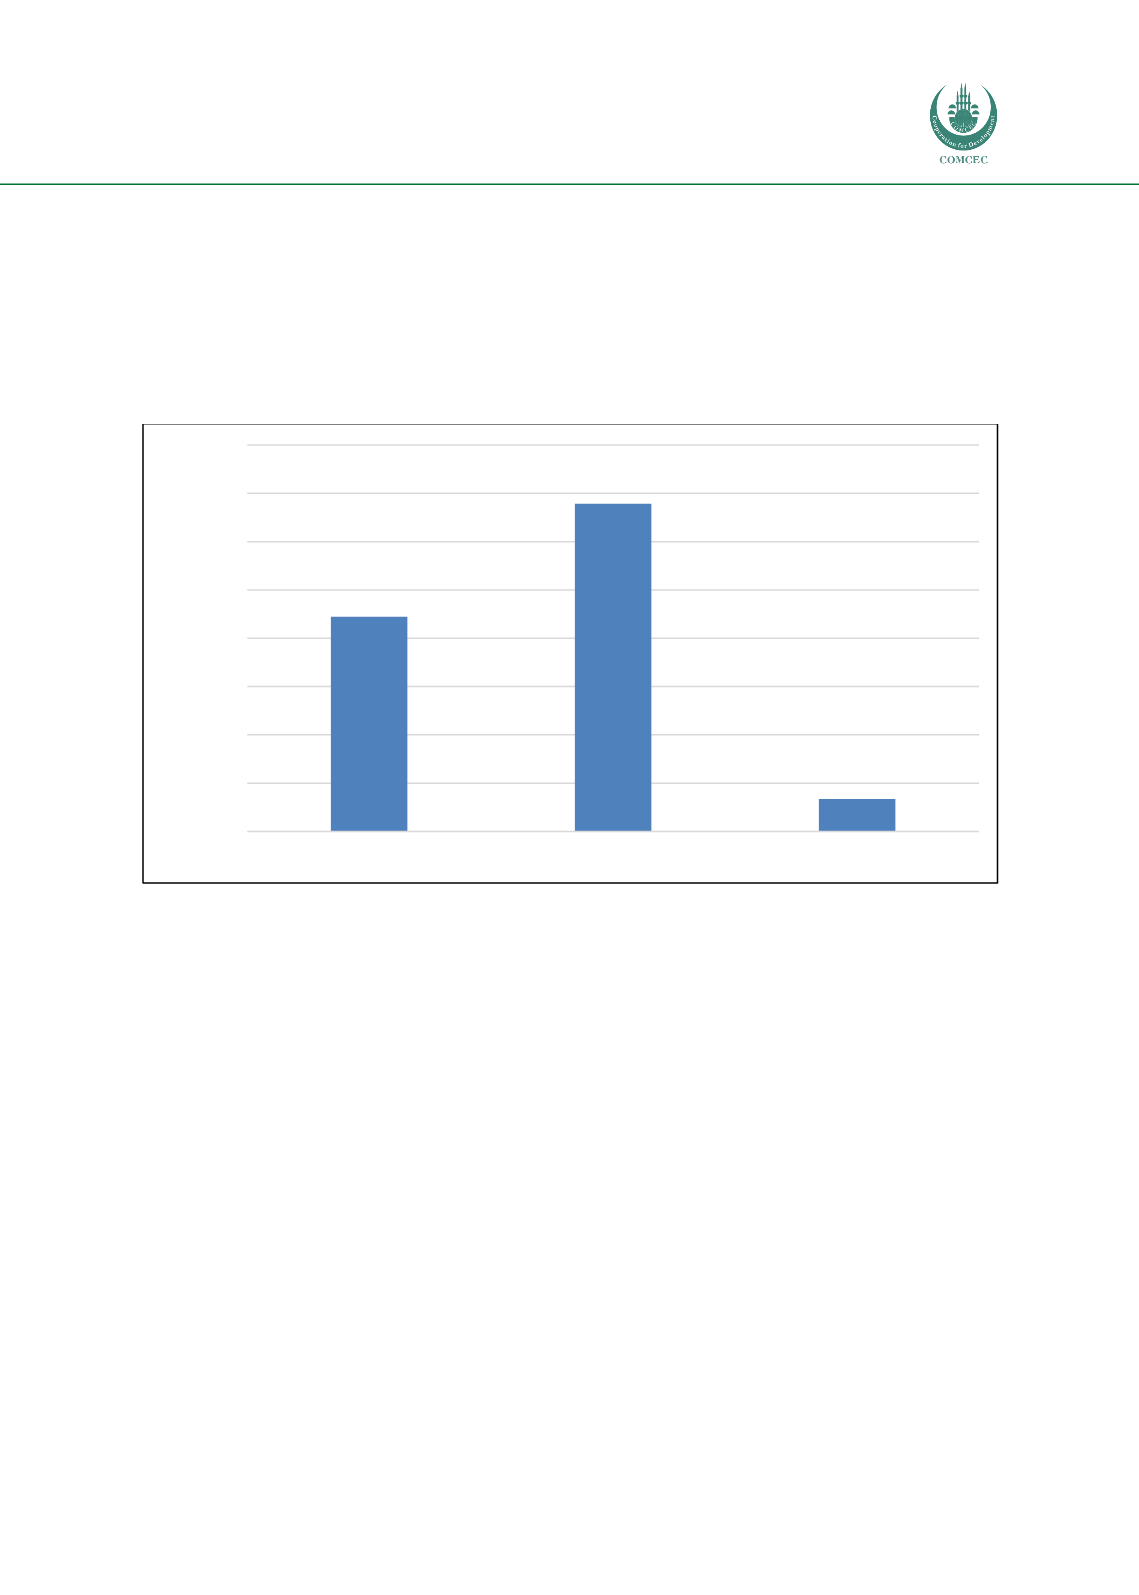
Figure 16 provides distribution of the container port traffic among the OIC regions in 2017. As
the figure shows, the OIC-MENA region outperforms other regions in terms of container port
traffic. In the OIC-MENA region UAE, Egypt, and Turkey were the top performers regarding
container throughput. For the OIC-Asia region most of the traffic were handled by a few
countries such as Malaysia and Indonesia. It should also be underlined that the scope of the
container port traffic is very limited in the OIC-Sub-Saharan Africa.
Figure 16: Container port traffic in the OIC regions (TEU: 20 foot equivalent units) (2017)
Source: The World Bank World Development Indicators
As of 2017, the container penetration intensity (share of containerisation in break bulk and
general cargo traffic) in several OIC countries were many times lower than the rate for the global
market (~100 TEU per 1,000 capita), and far lower than that of developed countries (~230 TEU
per 1,000 capita). Especially, some OIC countries such as Nigeria,
Sierra Leone
, and
13
show
very low container volumes in comparison with the size of their economies and populations as
Table 11 reveals. On the other hand, a few OIC countries (e.g. UAE and
Djibouti, and
Oman) have
very high container penetration levels although their figures should be readjusted to account for
their high transhipment traffic.
44.472.580
67.802.347
6.716.800
0
10.000.000
20.000.000
30.000.000
40.000.000
50.000.000
60.000.000
70.000.000
80.000.000
OIC Asia
OIC MENA
OIC Sub-Saharan Africa