


 33 / 133

COMCEC Trade Outlook 2018
25
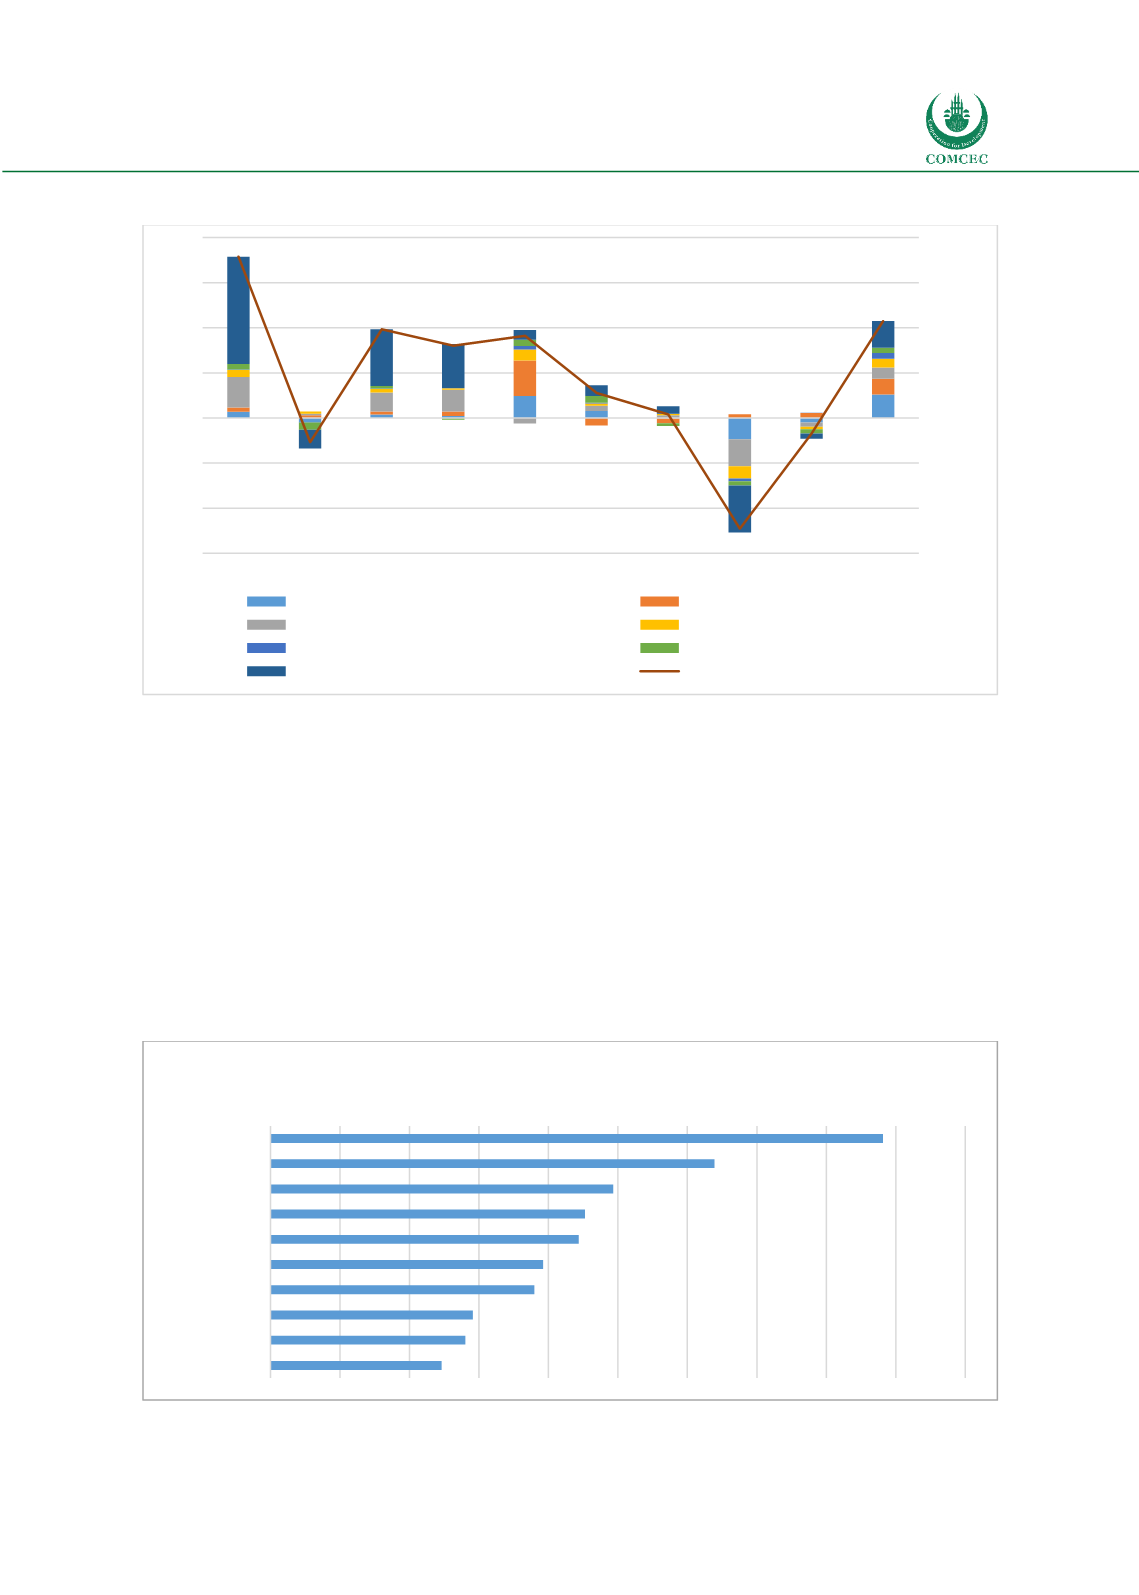
Figure 31: Contribution of Sectors to the Change in Intra OIC Exports
Source: ITC Trade map
The country breakdown of intra OIC trade which is provided in Appendix 4 reveals that intra
trade is highly concentrated as the sum of top three trading partners to total intra trade has a
very high ratio both in intra exports and intra imports. Moreover, it is observed that the
geographical proximity seems to be a major determinant of intra trade. Trade costs gets higher
with the distance between countries. This could be one of the factors accounting for the high
concentration of intra trade with the nearby countries.
3.2. Intra-OIC Merchandise Imports
The intra-OIC imports of UAE had the highest share in total intra OIC imports with 13.8 percent
followed by Turkey (10.0 per cent) and Iran with 7.7 per cent.
Figure 32: Intra OIC Imports in 2017
Source: IMF Direction of Trade Statistics
-30
-20
-10
0
10
20
30
40
-30
-20
-10
0
10
20
30
40
2008 2009 2010 2011 2012 2013 2014 2015 2016 2017
percentage change
per cent
Electrical machinery
Natural pearls…
Mineral fuels
Machinery
Tobacco
Vehicles
Other
Intra-OIC exports (secondary axis)
44
32
25
23
22
20
19
15
14
12
0
5
10 15 20 25 30 35 40 45 50
UAE
Turkey
Iran
Saudi Arabia
Indonesia
Pakistan
Malaysia
Egypt
Oman
Iraq
Billion USD