


 34 / 133

26
3.3. Intra Trade Balance
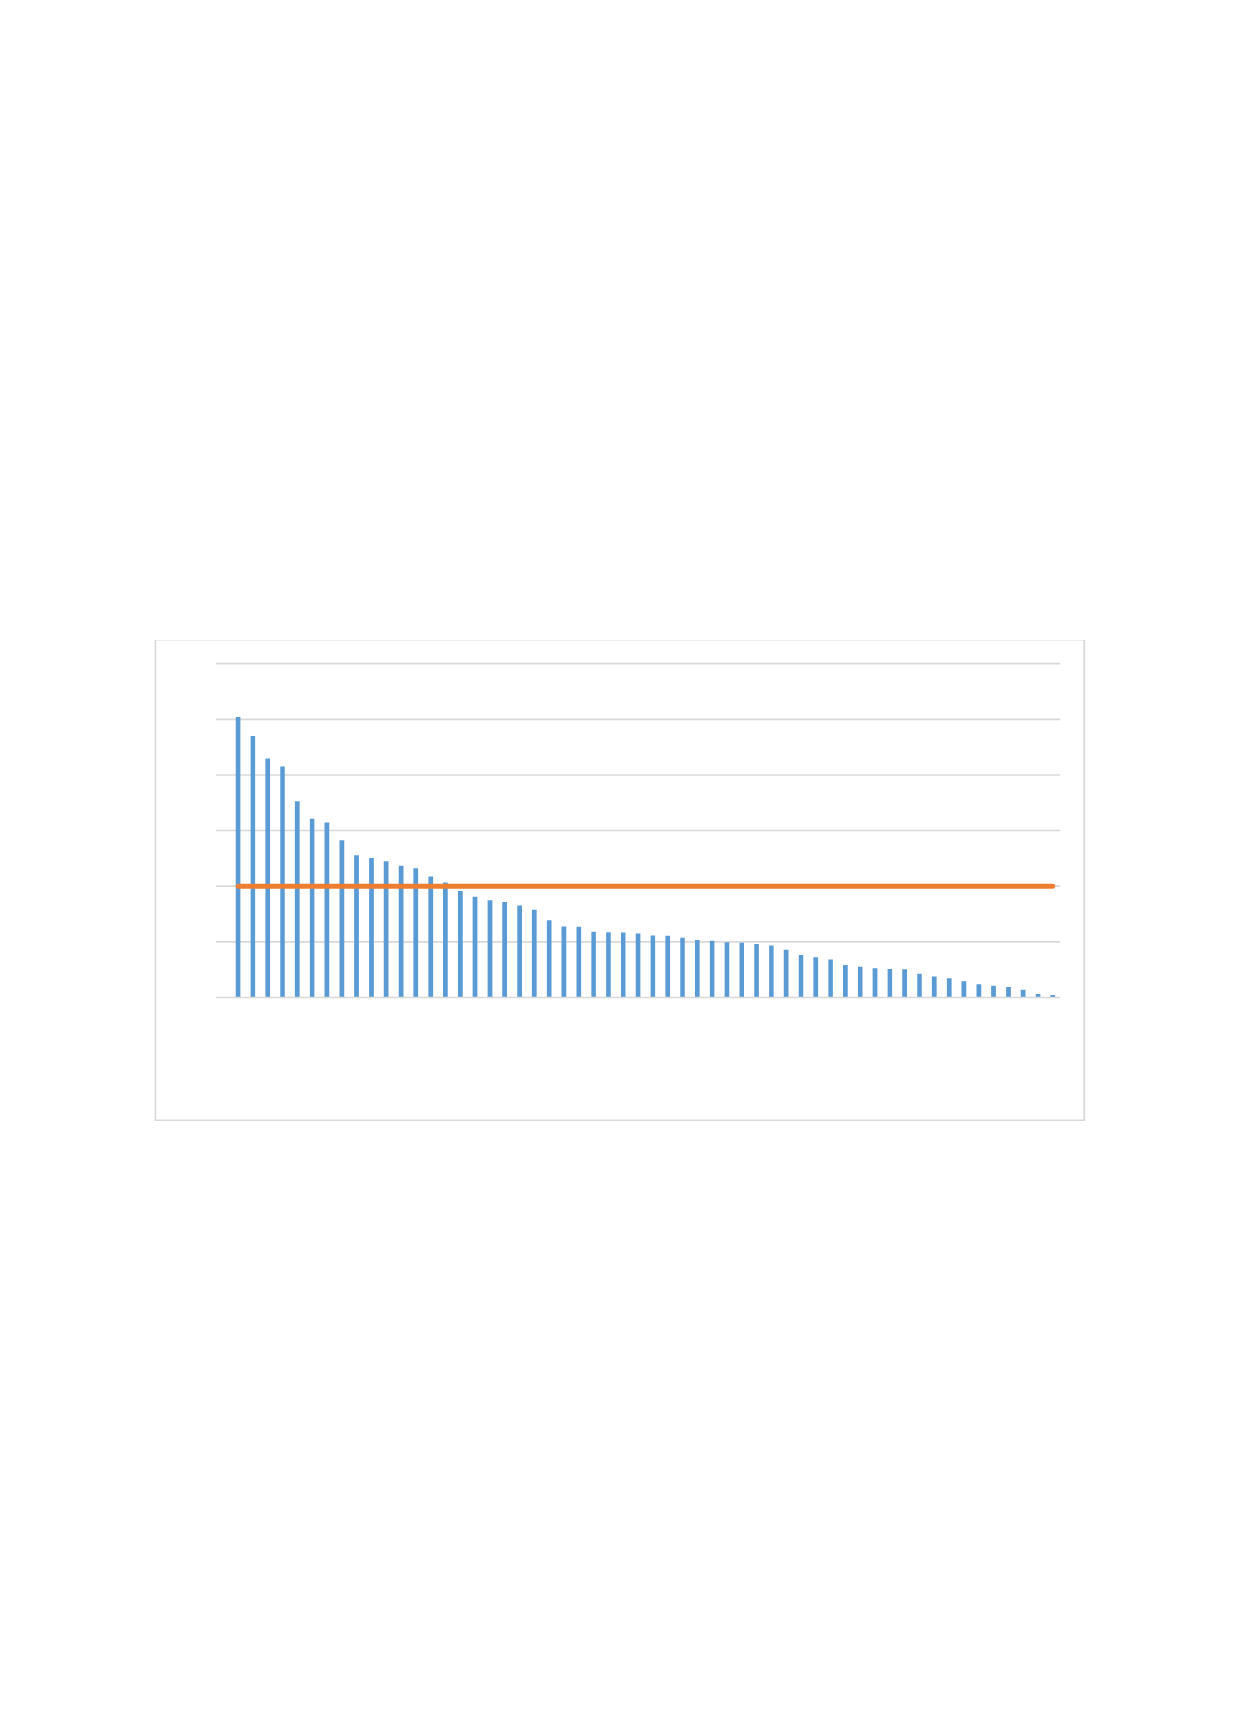
Comparison of countries whether they are net intra-exporters or net intra-importers could
provide some insights. Since there is great variation in terms of absolute values of trade across
OIC countries, the ratio of intra exports to intra imports could be used in order to compare the
value of imports against exports. According to this ratio those countries with a value less than
100 per cent are net intra-importers (i.e. they import more goods from OIC than they export to
other OIC countries) while those with a value more than 100 per cent are net intra-exporters.
Figure 33 depicts that fifteen OIC countries have a ratio over 100 implying that they are net intra
exporters. Suriname which has the largest intra-trade surplus ranks first and followed by
Bahrain, Nigeria, Saudi Arabia, Kazakhstan, Togo, UAE and Qatar. On the other hand 41 OIC
countries with a ratio below 100 are net intra importers. Among these net intra-importers
Maldives ranks first followed by Comoros, Albania and Sierra Leone.
Figure 33: Intra Trade Balances (ratio of intra-exports to intra imports) of the OIC
Countries 2017
Source: IMF Direction of Trade statistics
Note: The figure does not cover Suriname which is an outlier with a ratio
of 552.
0
50
100
150
200
250
300
Bahrain
Nigeria
Saudi Arabia
Kazakhstan
Togo
UAE
Qatar
Turkey
Libya
Guinea
Côte d'Ivoire
Malaysia
Uzbekistan
Azerbaijan
Brunei Darussalam
Indonesia
Kuwait
Sudan
Senegal
Algeria
Chad
Niger
Gabon
Kyrgyz Republic
Oman
Morocco
Tunisia
Benin
Gambia
Lebanon
Guyana
Iran
Jordan
Egypt
Cameroon
Tajikistan
Somalia
Burkina Faso
Uganda
Turkmenistan
Guinea-Bissau
Iraq
Syria
Mauritania
Mali
Pakistan
Bangladesh
Palestine
Djibouti
Mozambique
Afghanistan
Yemen
Sierra Leone
Albania
Comoros
Maldives