
COMCEC Agriculture Outlook 2016
34
Figure 27 shows the average value of food production from 1990-92 to 2011-13. As of
2011-2013 period, average value of food production in the OIC Member Countries reached to
223 Int. dollars/caput, where it was 182 Int. dollars/caput in 1990-1992. Between these
periods, it has increased 22 percent. However, in 2011-2013 OIC average value of food
production per caput was almost 40 percent lower than the world which shows a great gap
with respect to availability of food in the OIC Member Countries.
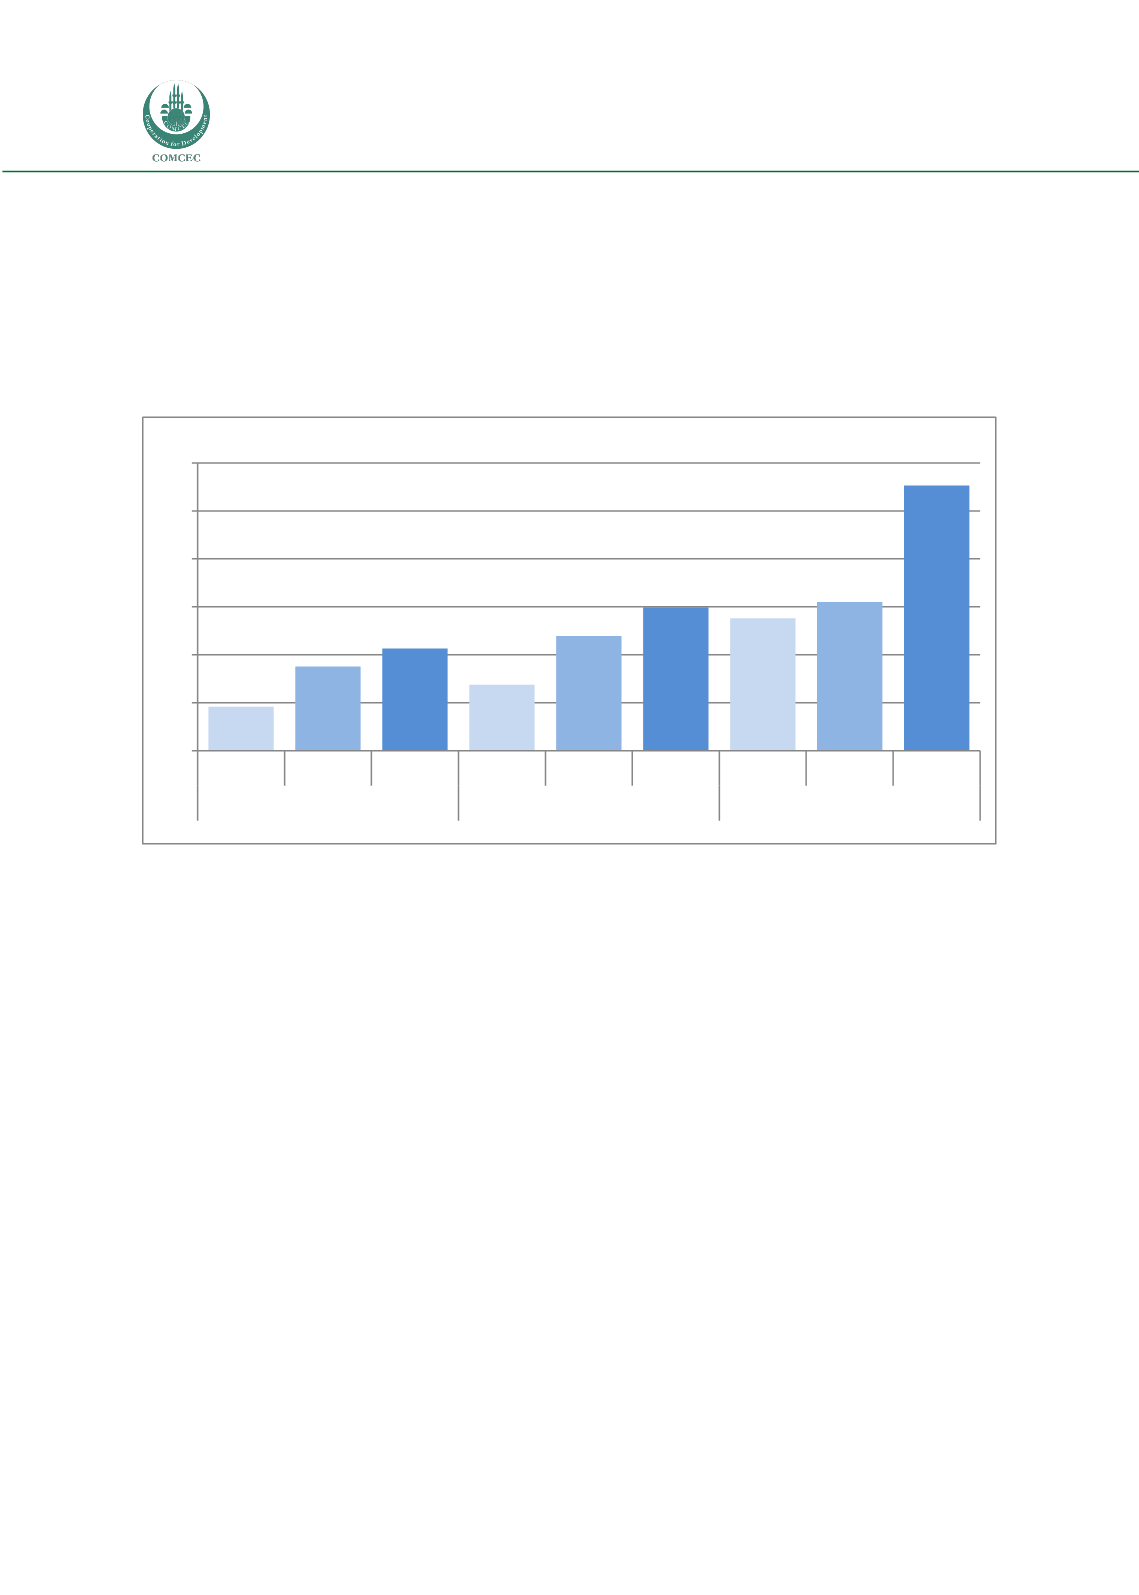
Figure 28. Average Value of Food Production in the OIC by Sub-Regions
Source: Calculated by using FAOSTAT
At the sub-regional level, Asian Group had the highest average value of food production
per caput with 251 Int. dollars/caput, where it was 195 Int. dollars/caput in 1990-1992. As of
2011-2013 period, Asian Group was followed by Arab Group and African Group with 200 Int.
dollars/caput and 183 Int. dollars/caput, respectively. In the last decade, while the growth of
average value of food production in African Group and Arab Group realized below 10 percent,
it is recorded as 24 percent in the Asian Group. This relatively high performance in Asian
Group enforced the food security of this region in terms of availability dimension.
In this study, the last indicator examined under the availability facet of food security is
average protein supply. Since the importance of proteins in human diets is substantial and they
are considered as the keystone of body organs, average protein intake of people closely
associated with sufficient and well-balanced nutrition. Therefore, average protein supply per
caput in a day is a useful indicator to measure the food security of a country or region.
158
175
183
167
188
200
195
202
251
140
160
180
200
220
240
260
1990-92 2000-02 2011-13 1990-92 2000-02 2011-13 1990-92 2000-02 2011-13
African Group
Arab Group
Asian Group
Int. dollars/caput


