


 44 / 101

COMCEC Agriculture Outlook 2016
33
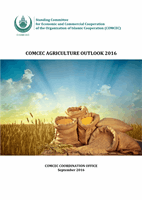
At the sub-regional level, average dietary energy supply adequacy is the highest in the
Arab Group with a 138 percent in 2014-2016. Considering the adequacy rate of developed
countries which is 136 percent, Arab Group has moderately higher dietary energy supply
adequacy than developed countries. Arab Group is followed by Asian and African Group with
120 percent of average dietary energy supply adequacy which is slightly lower than the world
average. On the other hand, even though the rate of growth in average dietary energy supply
adequacy is higher in African Group, it is still below the OIC average.
Figure 26. Average Dietary Energy Supply Adequacy in the OIC by Sub-Regions
Source: Calculated by using FAOSTAT
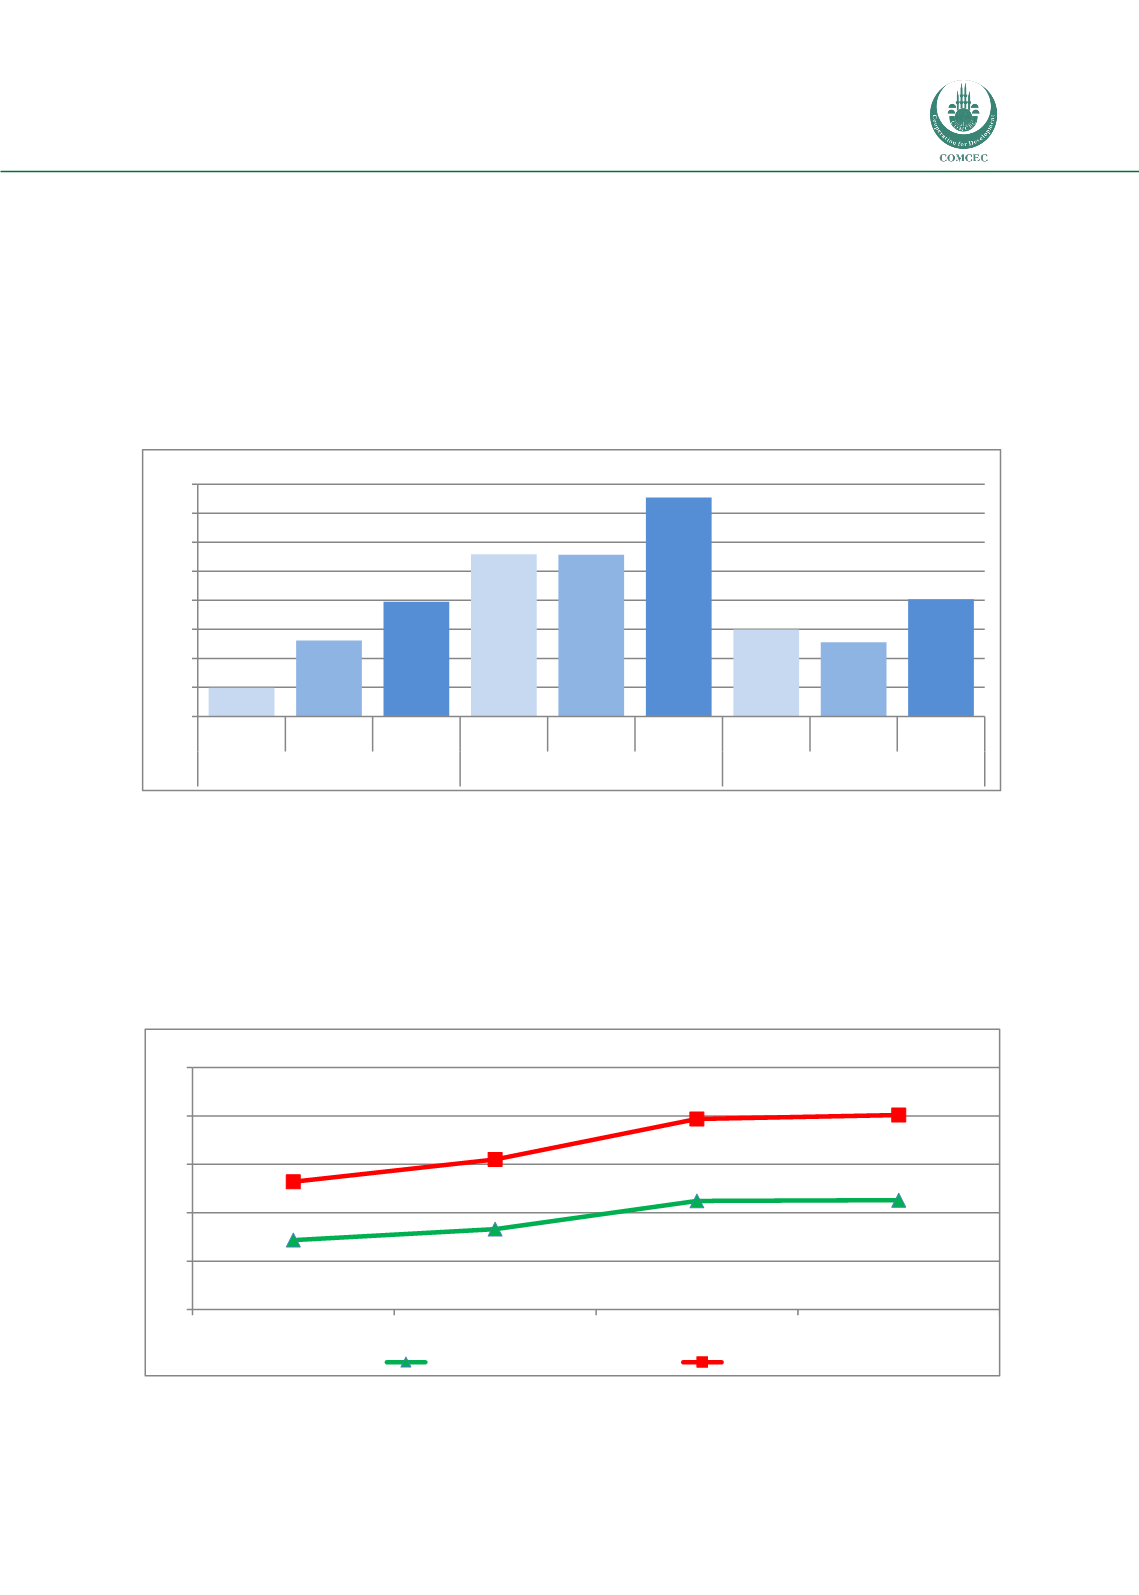
Average value of food production, which provides a cross country comparison of the
relative economic size of the food production in a country or region, is another indicator to
measure the availability aspects of food security. It is calculated in three year averages, and
expresses the food net production value, in constant 2004-06 international dollars terms, per
caput.
Figure 27. Average Value of Food Production in the OIC and World
Source: Calculated by using FAOSTAT
105
113
120
128
128
138
115
113
120
100
105
110
115
120
125
130
135
140
1990-92 2000-02 2014-16 1990-92 2000-02 2014-16 1990-92 2000-02 2014-16
African Group
Arab Group
Asian Group
Percent
181,7
193,1
222,2
223,0
242,0
265,0
307,0
311,0
110
160
210
260
310
360
1990-92
2000-02
2010-12
2011-13
Int. dollars/caput
OIC
World