


 40 / 101

COMCEC Agriculture Outlook 2016
29
that most of them have average precipitation less than 500 mm per year which shows high
prevalence of aridity in these countries. Especially, all countries located on Arab Group which
covers 20 countries have less than 500 mm precipitation level except for Comoros and
Lebanon. On the other hand, as at long-term average precipitation in depth 19 countries
possess more than 1,000 mm annually. Of these countries, Malaysia, Brunei, Indonesia,
Bangladesh, Sierra Leone, Guyana and Suriname receive over 2,000 mm.
When discussing the irrigation, it is not adequate to know their water potential in the
OIC. Additionally, we need to determine the situation regarding irrigation systems which
ensure the utilization of this potential in agriculture. As mentioned above, the large part of the
OIC Member Countries located in arid and semi-arid regions geographically. Hence,
widespread and modern irrigation systems, including water storage facilities are required.
In the OIC Member Countries as a whole traditional ways of irrigation are widely used.
Therefore, the efficient use of water in agriculture is not adequately addressed by the countries
of the region where sustainability of the existing irrigation systems is at stake. While surface
irrigation is by far the most widely used system in irrigation, practiced on 82.1 percent of the
total full and partial control irrigation area, the most water-saving system through micro-
irrigation techniques is only practiced on a mere 1.7 percent of the total irrigation area.
15
2.5.
Fertilizer
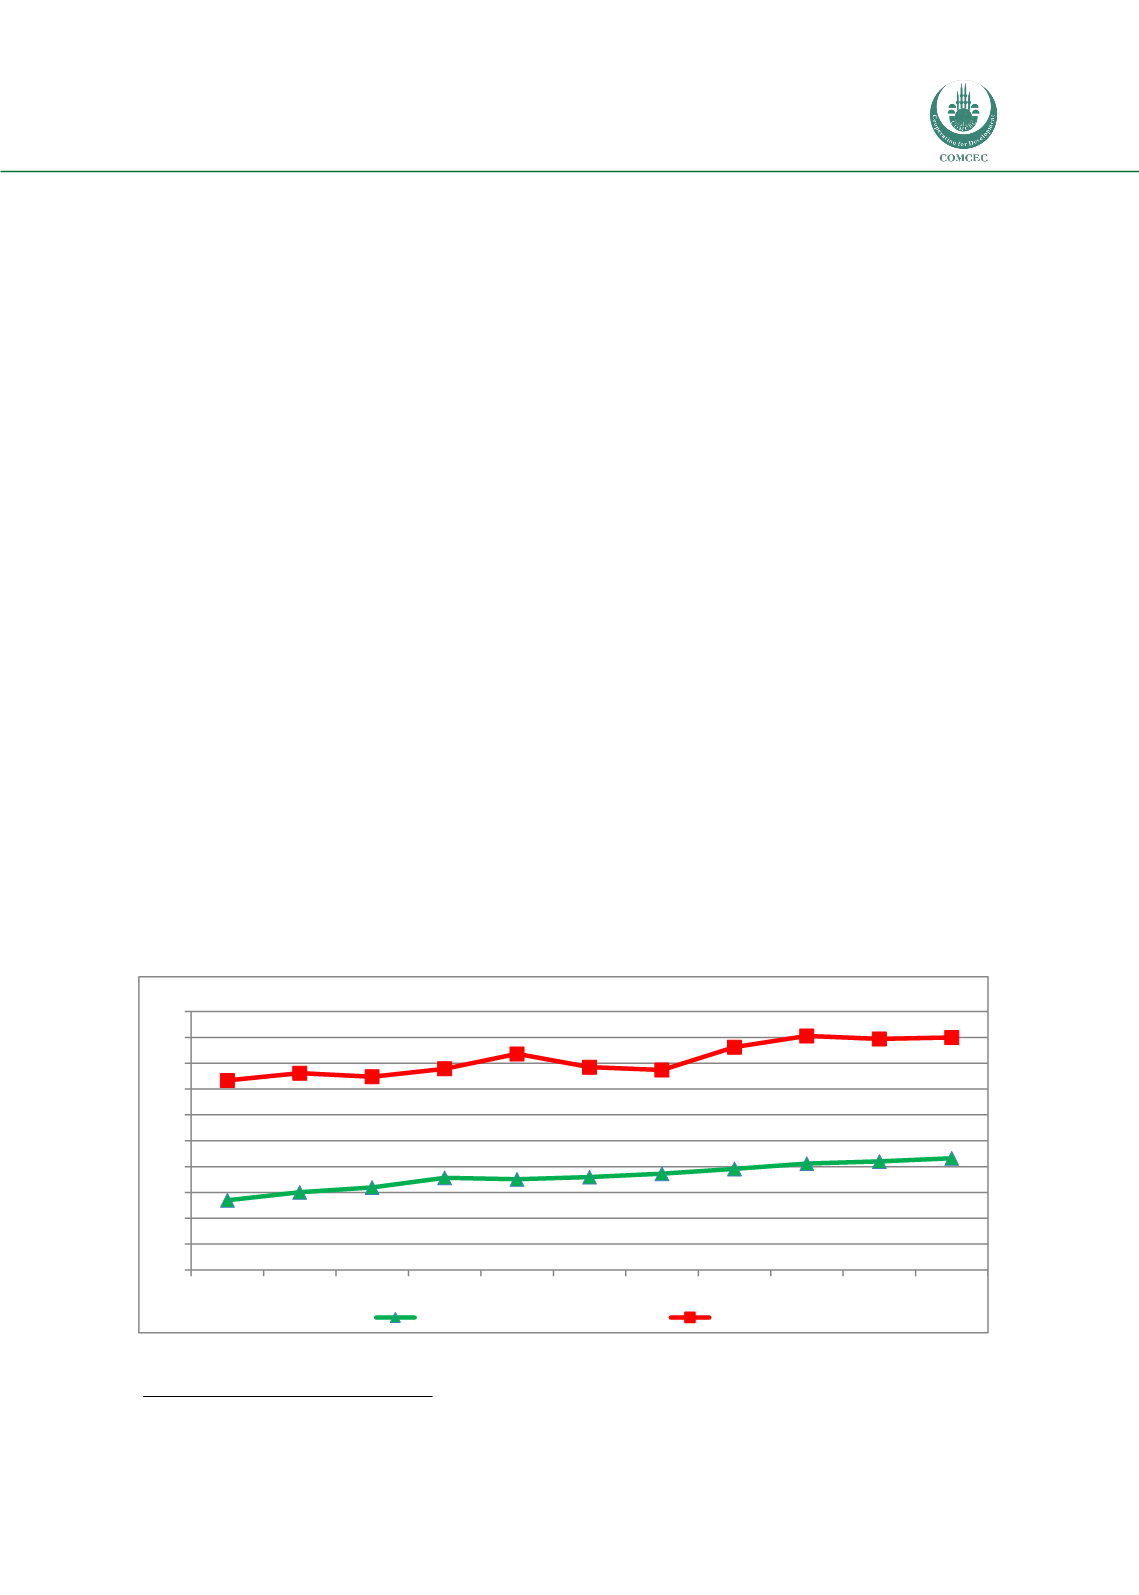
The average use of fertilizer per hectare in the OIC Member Countries increased from 57
kilograms in 2003 to 73 kilograms in 2013. However, the use of fertilizer in OIC Region is far
behind of the world average (Figure 23). As of 2013, the world average fertilizer use reached
120 kilograms which was more than 60 percent higher than the OIC average.
Figure 23. Fertilizer Use in the OIC and World
(2013)
Source: Calculated by using Worldbank Data and FAOSTAT
15
SESRIC, 2014
57,0 60,1 62,0 65,7 65,1 66,0 67,2 69,1 71,2 72,0 73,2
103,3 106,2 104,8 107,8
113,6
108,5 107,4
116,2
120,6
119,4
119,9
30
40
50
60
70
80
90
100
110
120
130
2003 2004 2005 2006 2007 2008 2009 2010 2011 2012 2013
kg/ha
OIC
World