


 46 / 101

COMCEC Agriculture Outlook 2016
35
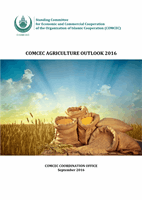
Figure 29. Average Protein Supply in the OIC and World
Source: Calculated by using FAOSTAT
Figure 29 illustrates that average protein supply per caput in a day in the OIC Member
Countries reached to 70.2 gr/caput in 2009-2011; while, it was 62.2 gr/caput at the beginning
of 1990s. Compared to the word, it was 12.5 percent lower than world average, and almost 47
percent lower than the developed countries in the period of 2009-2011.
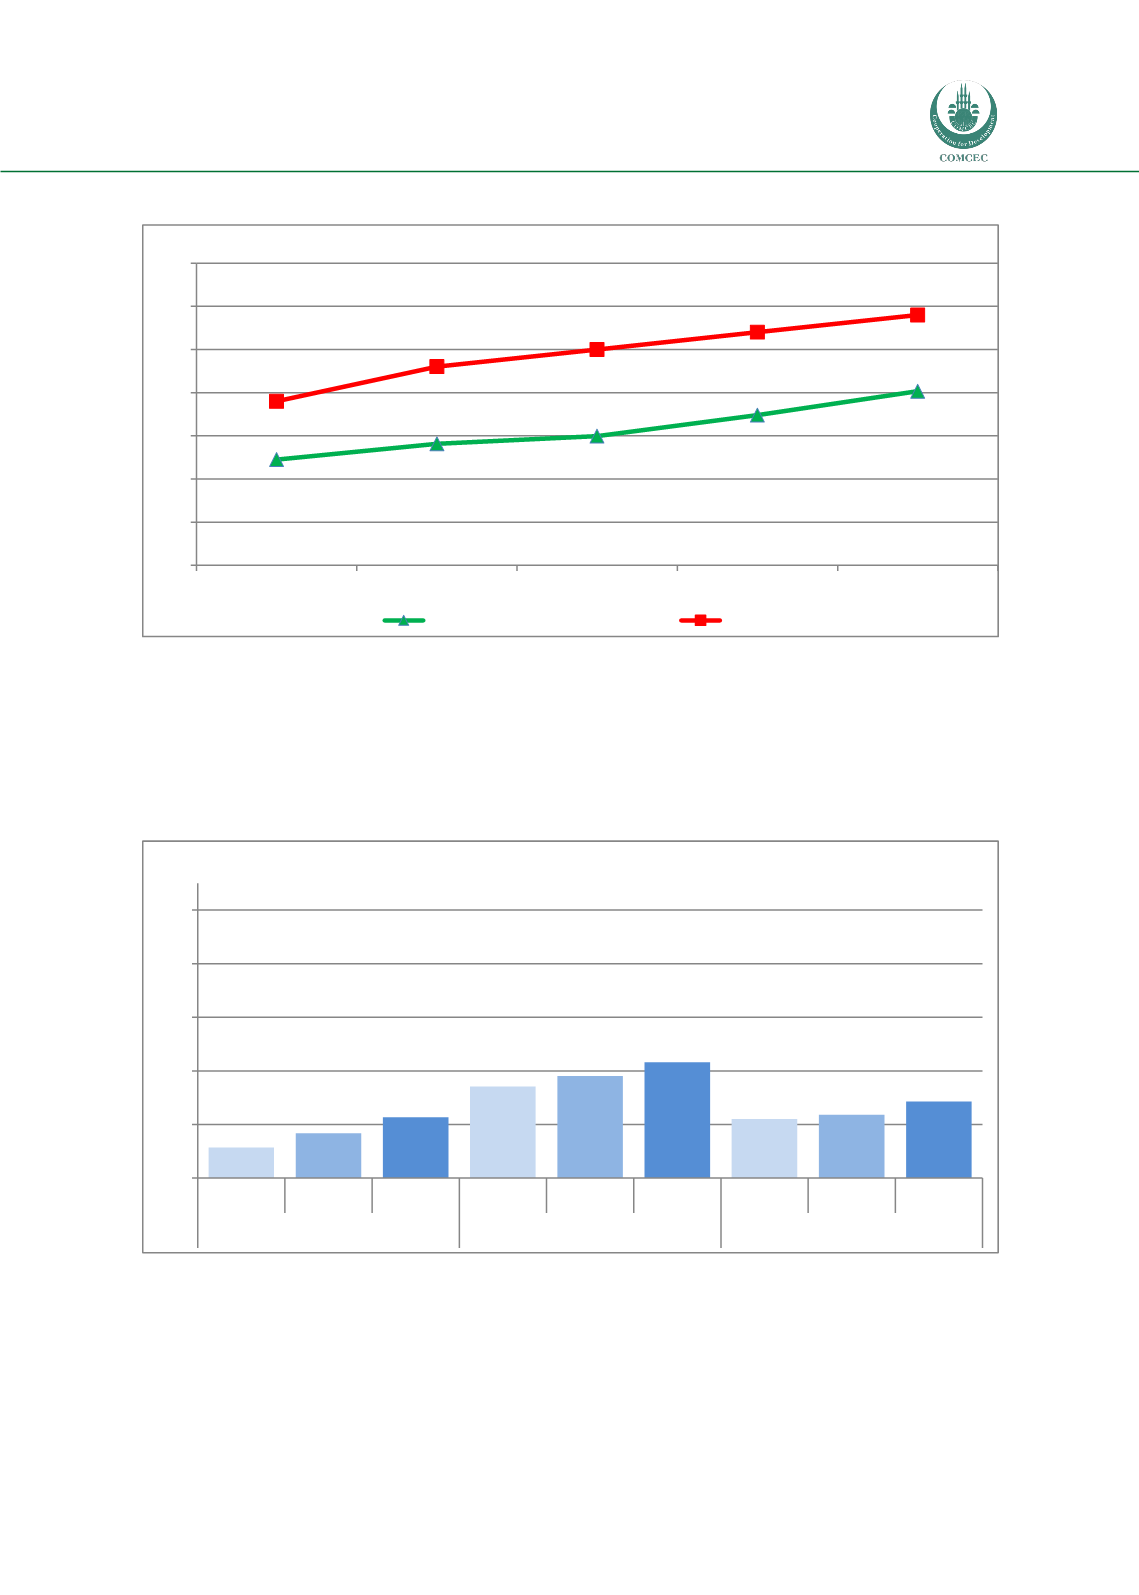
Figure 30. Average Protein Supply in the OIC by Sub-Regions
Source: Calculated by using FAOSTAT
At the sub-regional level, Arab Group had the highest average protein supply per caput
in a day with 83 gr/caput in 2009-2011. Arab Group was followed by Asian Group and African
Group with 69 gr/caput, and 63 gr/caput, respectively. There has been sufficient protein
62,2
64,1
65,0
67,4
70,2
69,0
73,0
75,0
77,0
79,0
50
55
60
65
70
75
80
85
1990-92
1995-97
2000-02
2005-07
2009-11
gr/caput/day
OIC
World
51
57
63
74
78
83
62
64
69
40
60
80
100
120
140
1990-92 2000-02 2009-11 1990-92 2000-02 2009-11 1990-92 2000-02 2009-11
African Group
Arab Group
Asian Group
gr/caput/day