


 43 / 101

COMCEC Agriculture Outlook 2016
32
in the OIC Member Countries in following years. In this study, the general picture of food losses
and waste in the world is presented with the aim of raising the awareness of the Member
Countries this issue, and thereby encouraging the Member Countries to produce reliable and
up-to-date statistics on food losses and waste.
3.1.
Availability
According to FAO definition, availability refers to physical availability of food. It
addresses the supply side of food security and is determined by the level of food production,
stock levels and net trade.
19
Therefore, the availability aspect of food security deals with
whether there is sufficient quantity of food available on a consistent basis at the household,
community, country or international level to provide food for everyone.
The availability dimension of food security can be measured by various indicators such
as average dietary energy supply adequacy, average value of food production, share of dietary
energy supply derived from cereals, roots and tubers, average protein supply, average supply
of protein of animal origin. For the scope of this study, average dietary energy supply
adequacy, average value of food production and average protein supply are taken into
consideration.
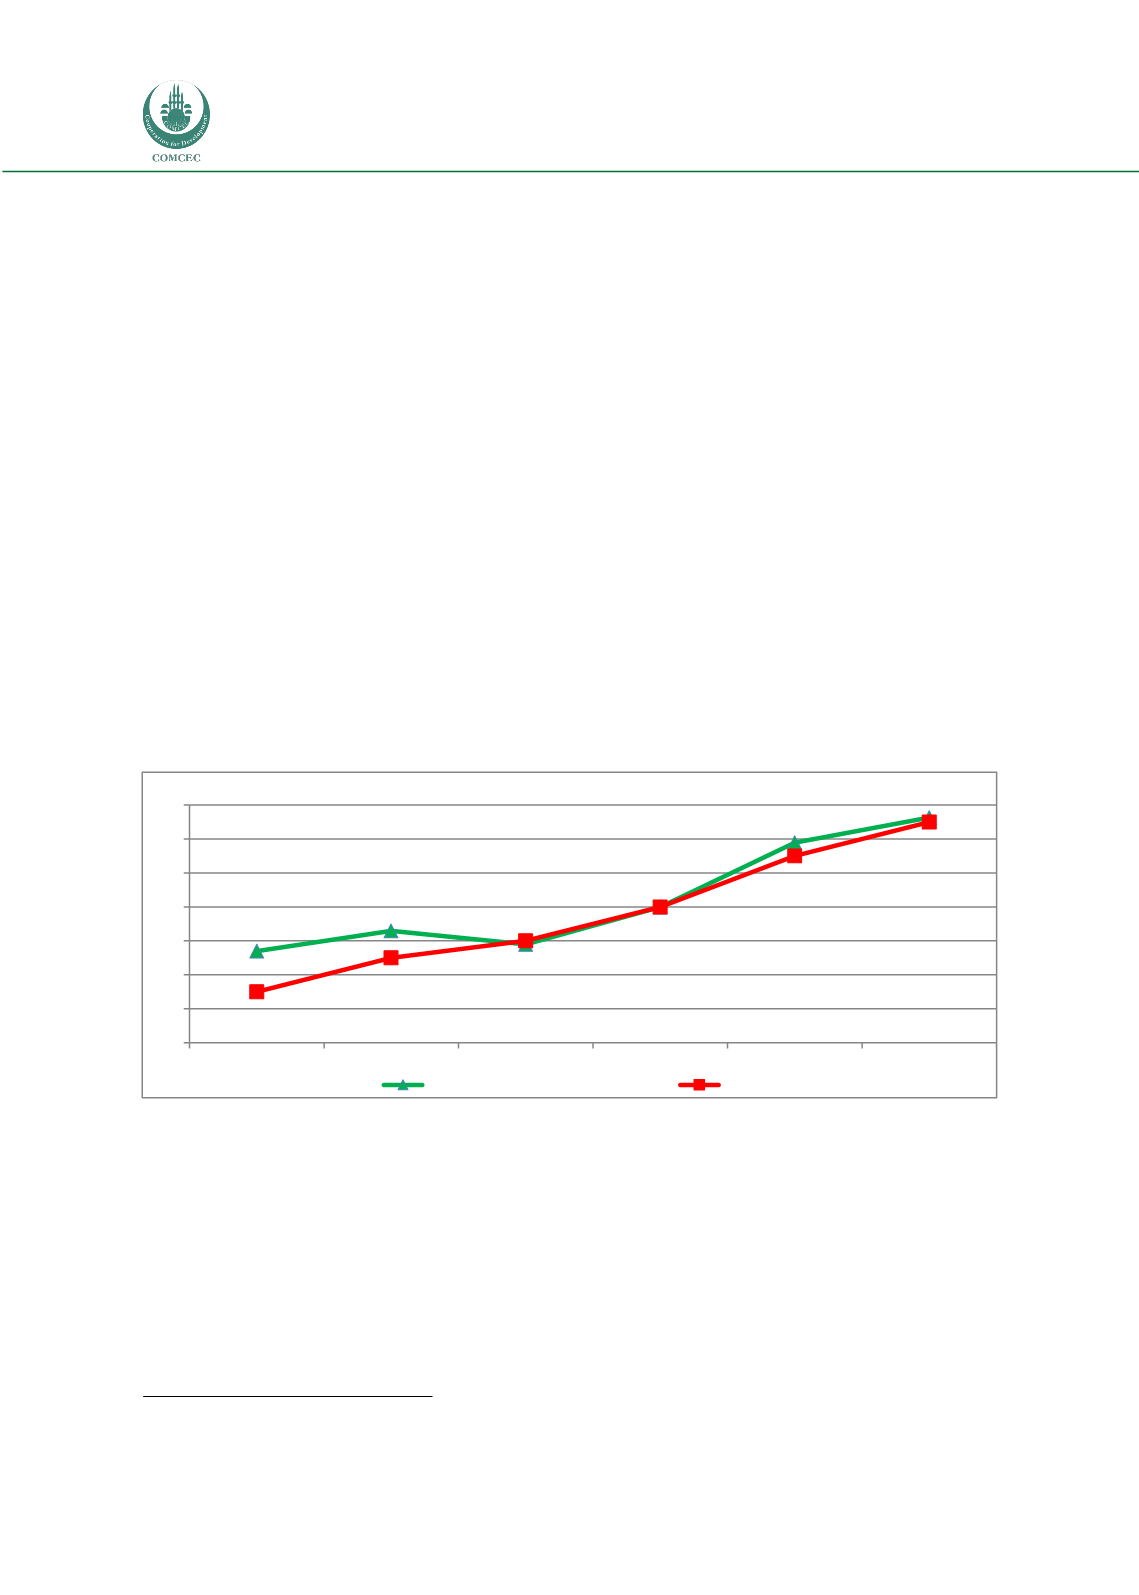
Figure 25. Average Dietary Energy Supply Adequacy in the OIC and World
Source: Calculated by using FAOSTAT
Figure 25 illustrates the developments in average dietary energy supply adequacy in the
OIC and world. It is calculated in three year averages from 1990-92 to 2014-16 to provide an
index of adequacy of the food supply in terms of calories. As it is seen in the figure, there is not
a serious problem in the OIC in terms of average dietary energy supply adequacy. According to
2014-2016 period estimation, the average dietary energy supply adequacy of OIC Member
Countries will reach to 123.3 percent; where it was 115.4 percent in the period 1990-1992.
Average dietary energy supply adequacy in the OIC has become slightly higher compared to
the world recently.
19
FAO, 2008
115,4
116,6
115,8
118,0
121,8
123,3
113,0
115,0
116,0
118,0
121,0
123,0
110
112
114
116
118
120
122
124
1990-92
1995-97
2000-02
2005-07
2010-12
2014-16*
Percent
OIC
World