
COMCEC Agriculture Outlook 2016
38
rail lines density, gross domestic product per capita, domestic food price index, prevalence of
undernourishment, share of food expenditure of the poor, depth of the food deficit, prevalence
of food inadequacy.
22
Since the economic power of a country and individuals directly affects
the level of food accessibility, only food affordability as the most important concept under the
food access is taken into consideration in this study. Hence, for the scope of this study gross
domestic product per capita and domestic food price index are chosen as indicators to
measure the food access of the OIC Member Countries.
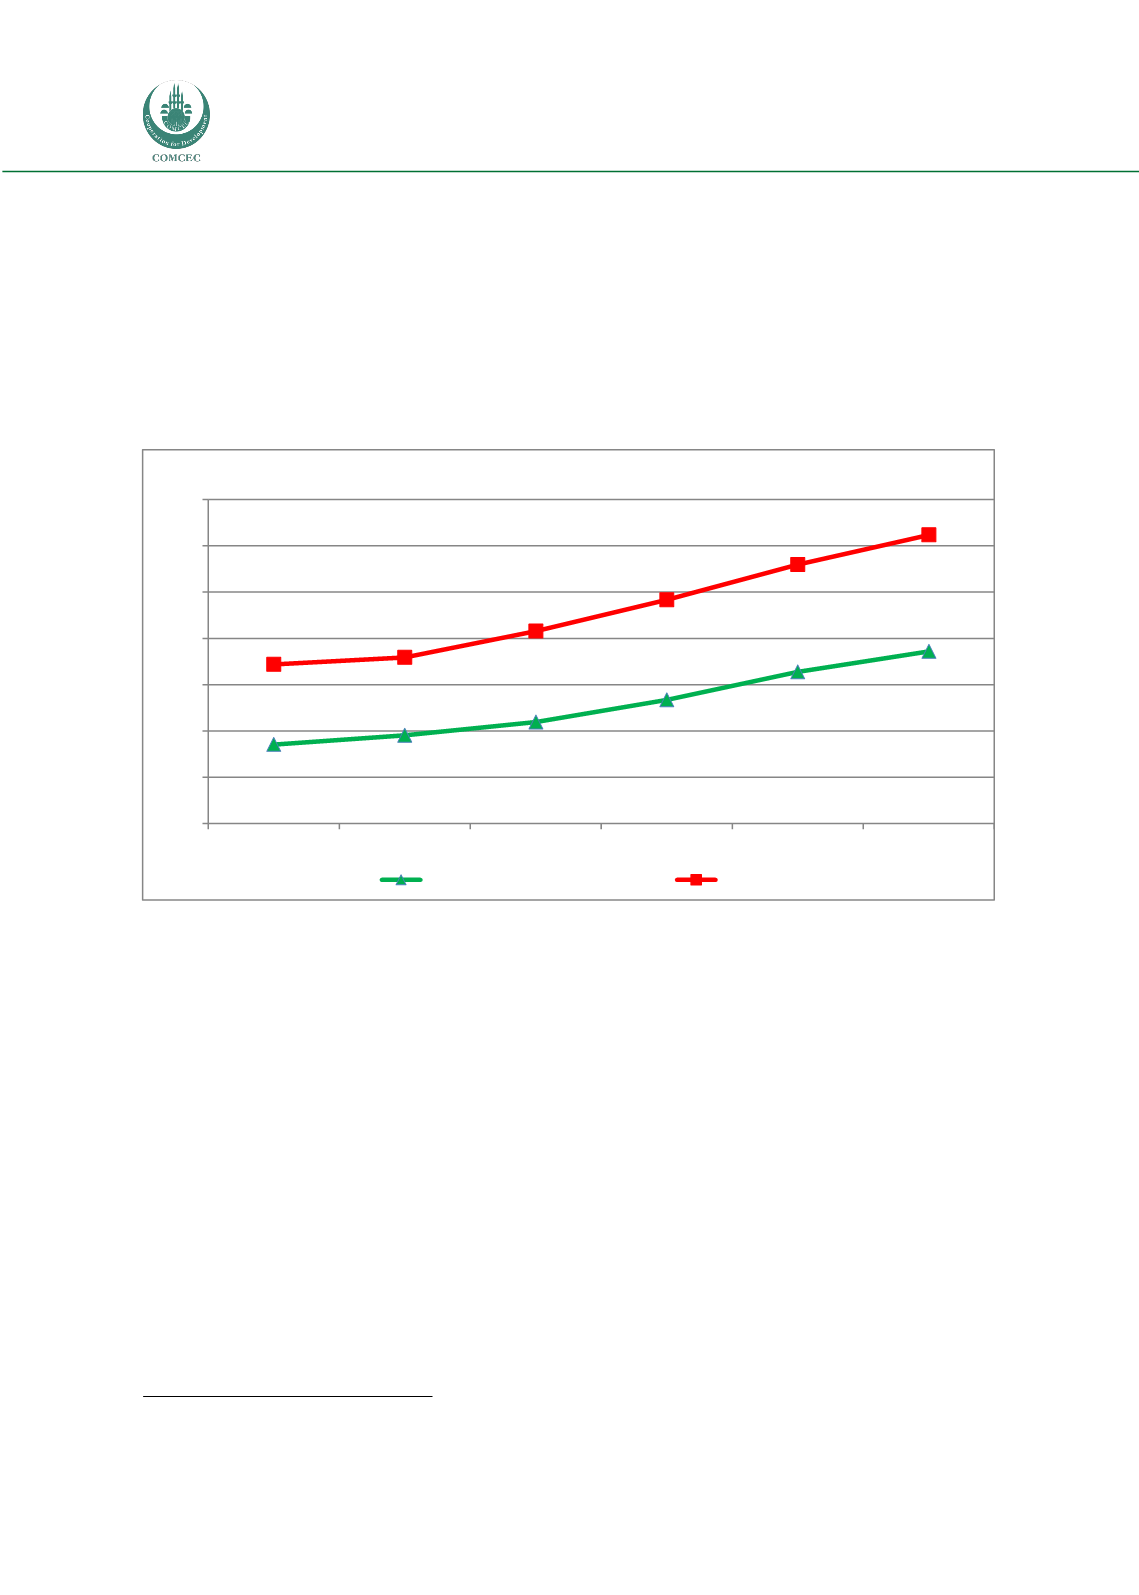
Figure 33. GDP Per Capita in the OIC and World
Source: Calculated by using FAOSTAT considering the purchasing power parity rates.
Figure 33 demonstrates the developments in GDP per capita based on constant 2011
International Dollars using purchasing power parity rates in the OIC and world by using a
weighted population average. Therefore, this indicator provides information on the possibility
of economical access to markets taking into account the purchasing power of regions. As it is
seen in the figure, average GDP per capita of the OIC Member Countries reached to 9,500 Int.
Dollars, while it was 5,400 Int. Dollars in 1990s. Compared to the world, average GDP per
capita of the OIC Member Countries was far away from the world average, which was almost
14,500 Int. Dollars in 2014. Nonetheless, the growth in the GDP per capita of the OIC Member
Countries in the period 1990-2014 realized as 74 percent, which was higher than the world’s
one, 63 percent.
22
FAO, 2015b
5.413
5.811
6.386
7.347
8.550
9.436
8.875
9.177
10.311
11.668
13.182
14.463
2000
4000
6000
8000
10000
12000
14000
16000
1990
1995
2000
2005
2010
2014
Dollar
OIC
World


