
COMCEC Agriculture Outlook 2016
39
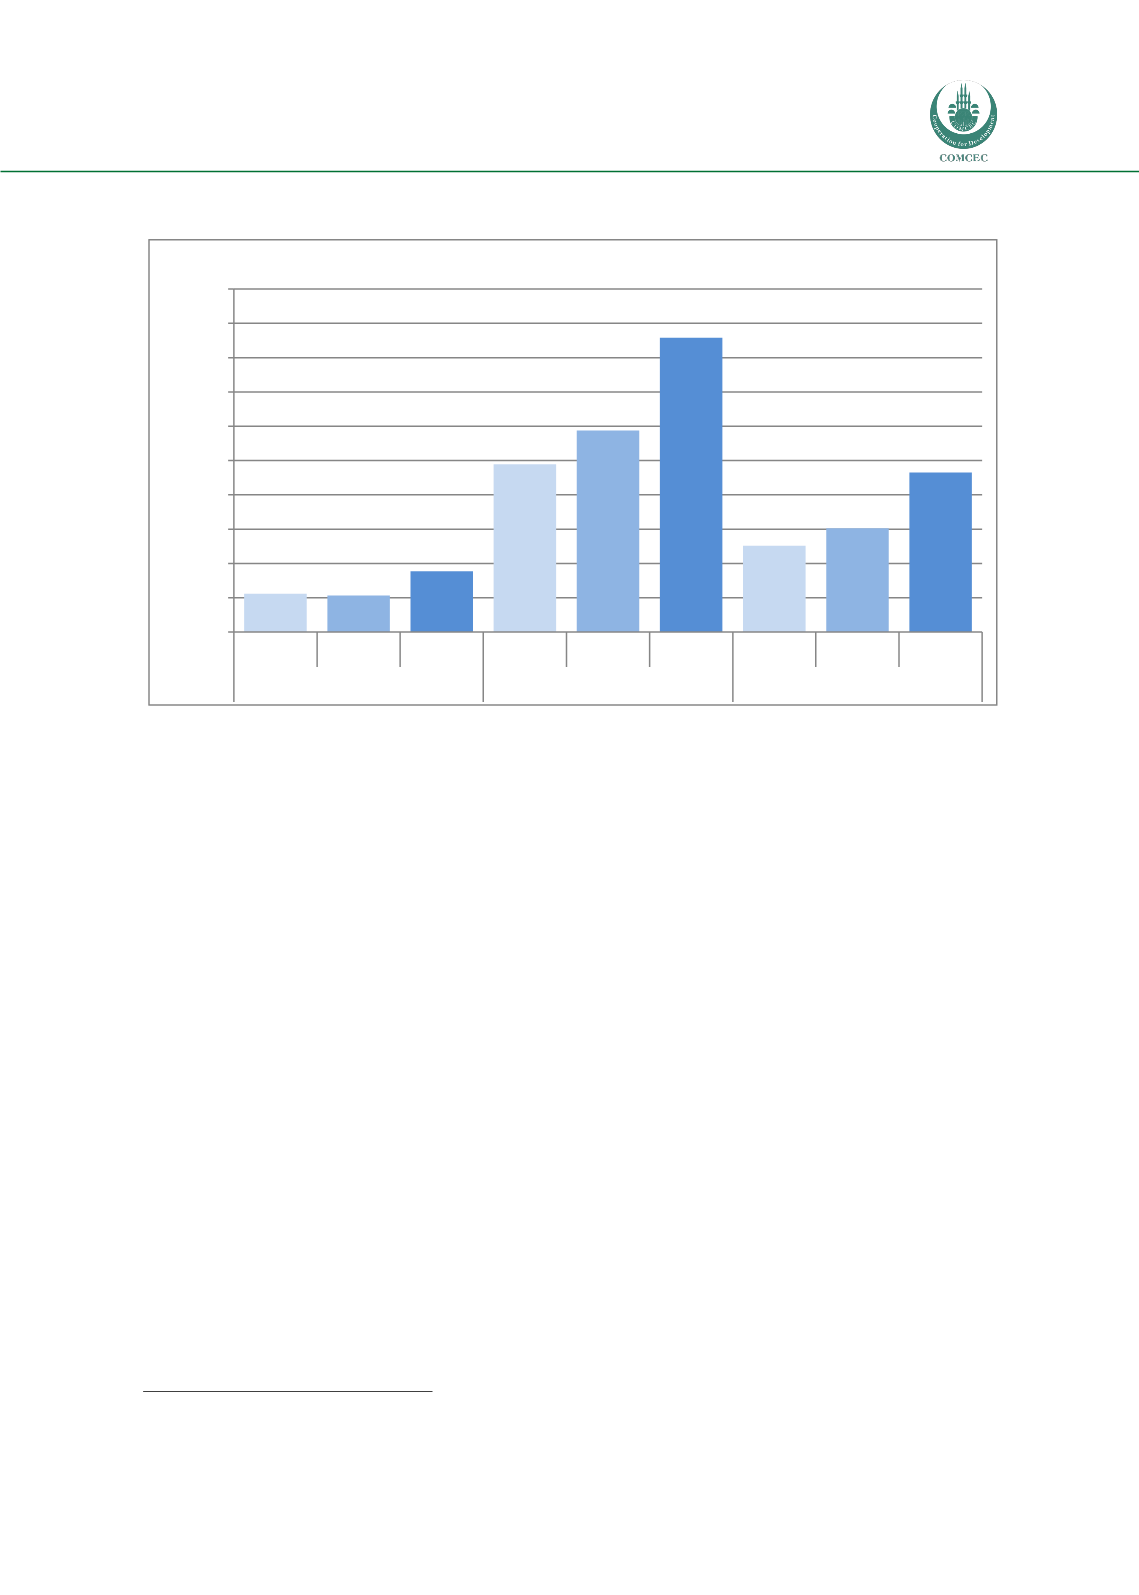
Figure 34. GDP Per Capita in the OIC by Sub-Regions
Source: Calculated by using FAOSTAT considering the purchasing power parity rates.
At the sub-regional level, average GDP per capita of Arab Group was the highest with
17,150 Int. Dollars in 2013. It was followed by Asian Group and African Group with 9,300 Int.
Dollars and 3,500 Int. Dollars, respectively. It can be noted that the food access of African
Group with respect to affordability which will be resulted in better nutritional outcomes and
improving access to adequate food in terms of both quantity and quality needs to be improved
soon.
Secondly, domestic food price index, which compares the relative price of food across
countries and over time, is another meaningful indicator to measure the food accessibility of a
country and region. It is calculated as the ratio of food and non-alcoholic beverages
expenditure to actual individual consumption in purchasing power parity terms.
According to FAO data, domestic food price index of the world has increased by 133
percent in the period of 2000-2013.
23
In most of the OIC Member Countries, domestic food
price index has boosted substantially and this has limited access to food especially by low
income people and deteriorates the food security in the OIC. Particularly, the Gambia, Guinea,
Mozambique, Nigeria, Sierra Leone and Uganda in the African Group; Egypt, Iraq, Syrian Arab
Republic, Yemen in the Arab Group; and Azerbaijan, Bangladesh, Brunei Darussalam,
Indonesia, Iran, Kazakhstan, Pakistan, Suriname in the Asian Group are the countries which
faced high inflation in domestic food prices (see Annex 34). These data has proven that OIC
Member Countries seem to be more affected from the food price increase in the last decade.
The main reasons of an increase in domestic food price in the OIC Member Countries are
23
FAO, 2015b
2.232 2.123
3.540
9.773
11.745
17.154
5.030
6.052
9.294
0
2.000
4.000
6.000
8.000
10.000
12.000
14.000
16.000
18.000
20.000
1990
2000
2014
1990
2000
2014
1990
2000
2014
African Group
Arab Group
Asian Group
Dollar


