


 23 / 101

COMCEC Agriculture Outlook 2016
12
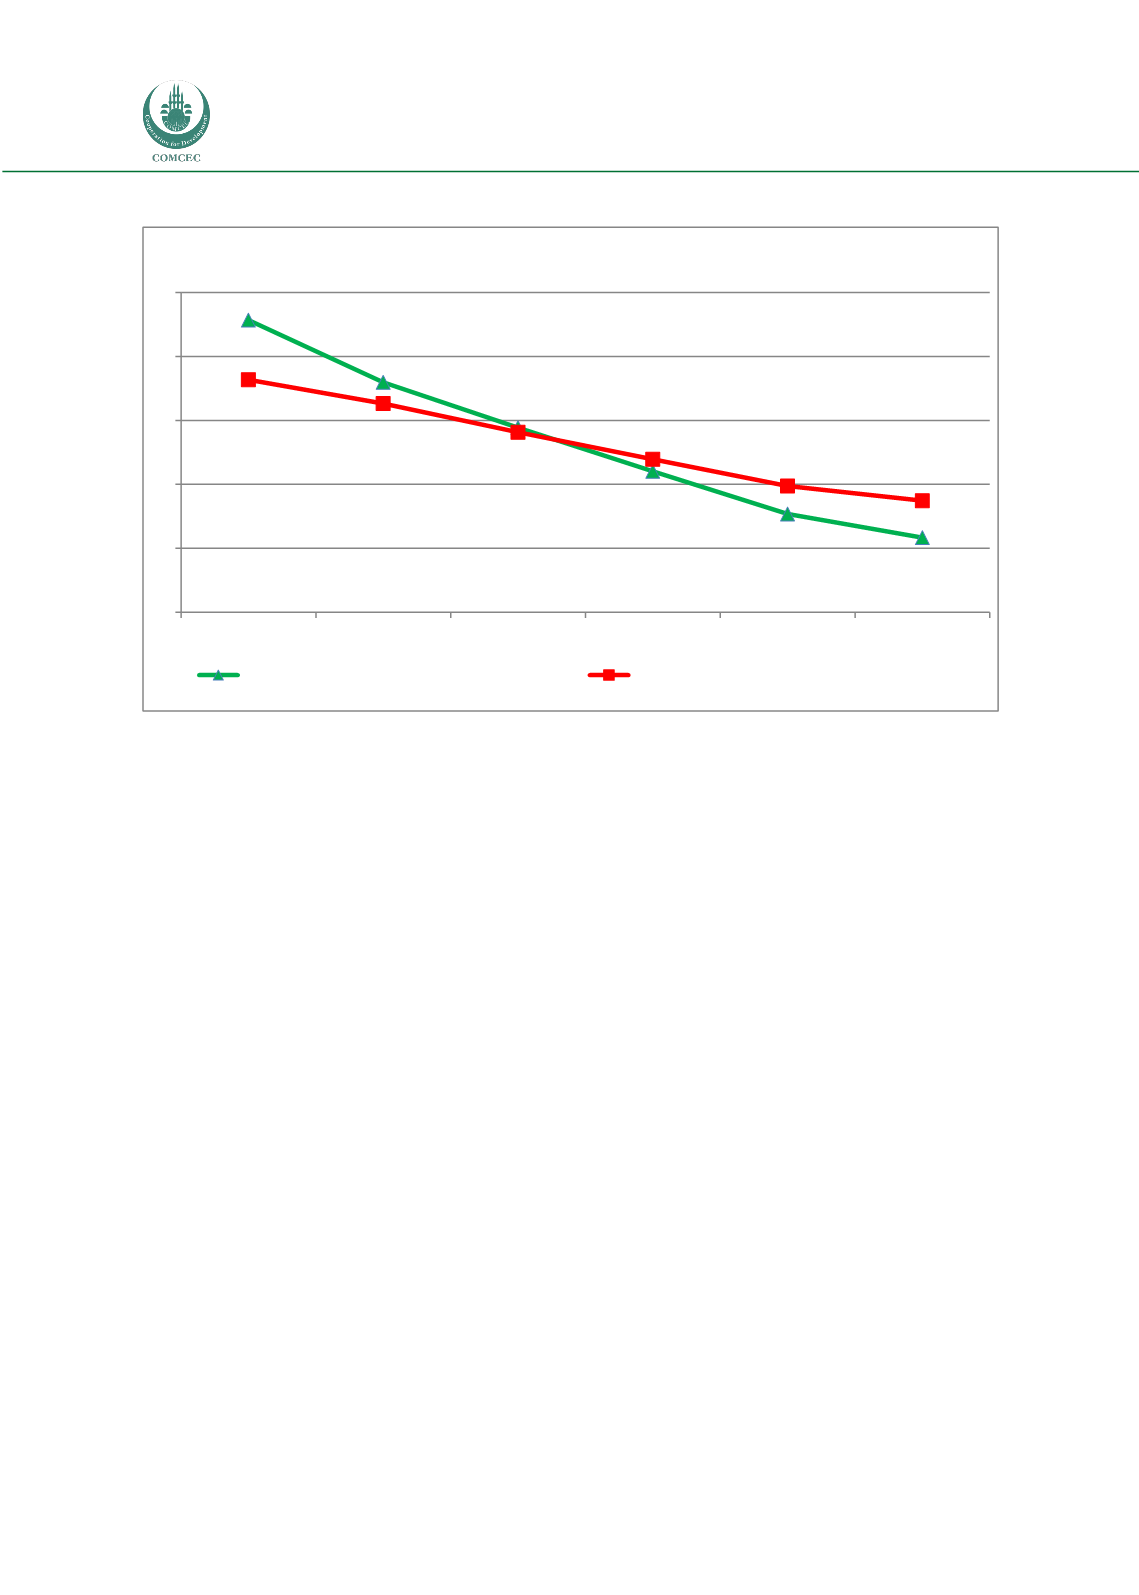
Figure 8. Share of Agricultural Employment in the OIC and World
Source: Calculated by using FAOSTAT
The decline in the proportion of agricultural employment can be explained by biological,
chemical, and mechanical advances eliminating many plantation, cultivation and harvesting
task, increasing agricultural productivity, rapid urbanization, and non-farm activities
providing an increasingly important share of rural incomes.
1.5.
Trade
Agricultural commodity trade of the 57 OIC Member Countries increased considerably in
the period from 1990 to 2013. Total agricultural trade in the OIC Member Countries grew by
more than 5 times from in this period and reached 357 billion US Dollars in 2013 (Figure 9). In
2013, total agricultural commodity import of the OIC Member Countries reached to 224 billion
US Dollars from 35 billion US Dollars in 1990. Correspondingly, total agricultural commodity
export of OIC was as 133 billion US Dollars in 2013, where it was 20 billion US Dollars in 1990.
Compared to 2012 and 2013, while the increasing trend in agricultural import has still
continued, agricultural export has remained same level. This situation leads to an increase in
the trade deficit of OIC Member Countries.
52.8
48.0
44.4
41.0
37.7
35.8
48.2
46.3
44.1
42.0
39.9
38.7
30
35
40
45
50
55
1990
1995
2000
2005
2010
2013
Percent
Share of Active Agriculture Worker in the OIC
Share of Active Agriculture Worker in the World