


 21 / 101

COMCEC Agriculture Outlook 2016
10
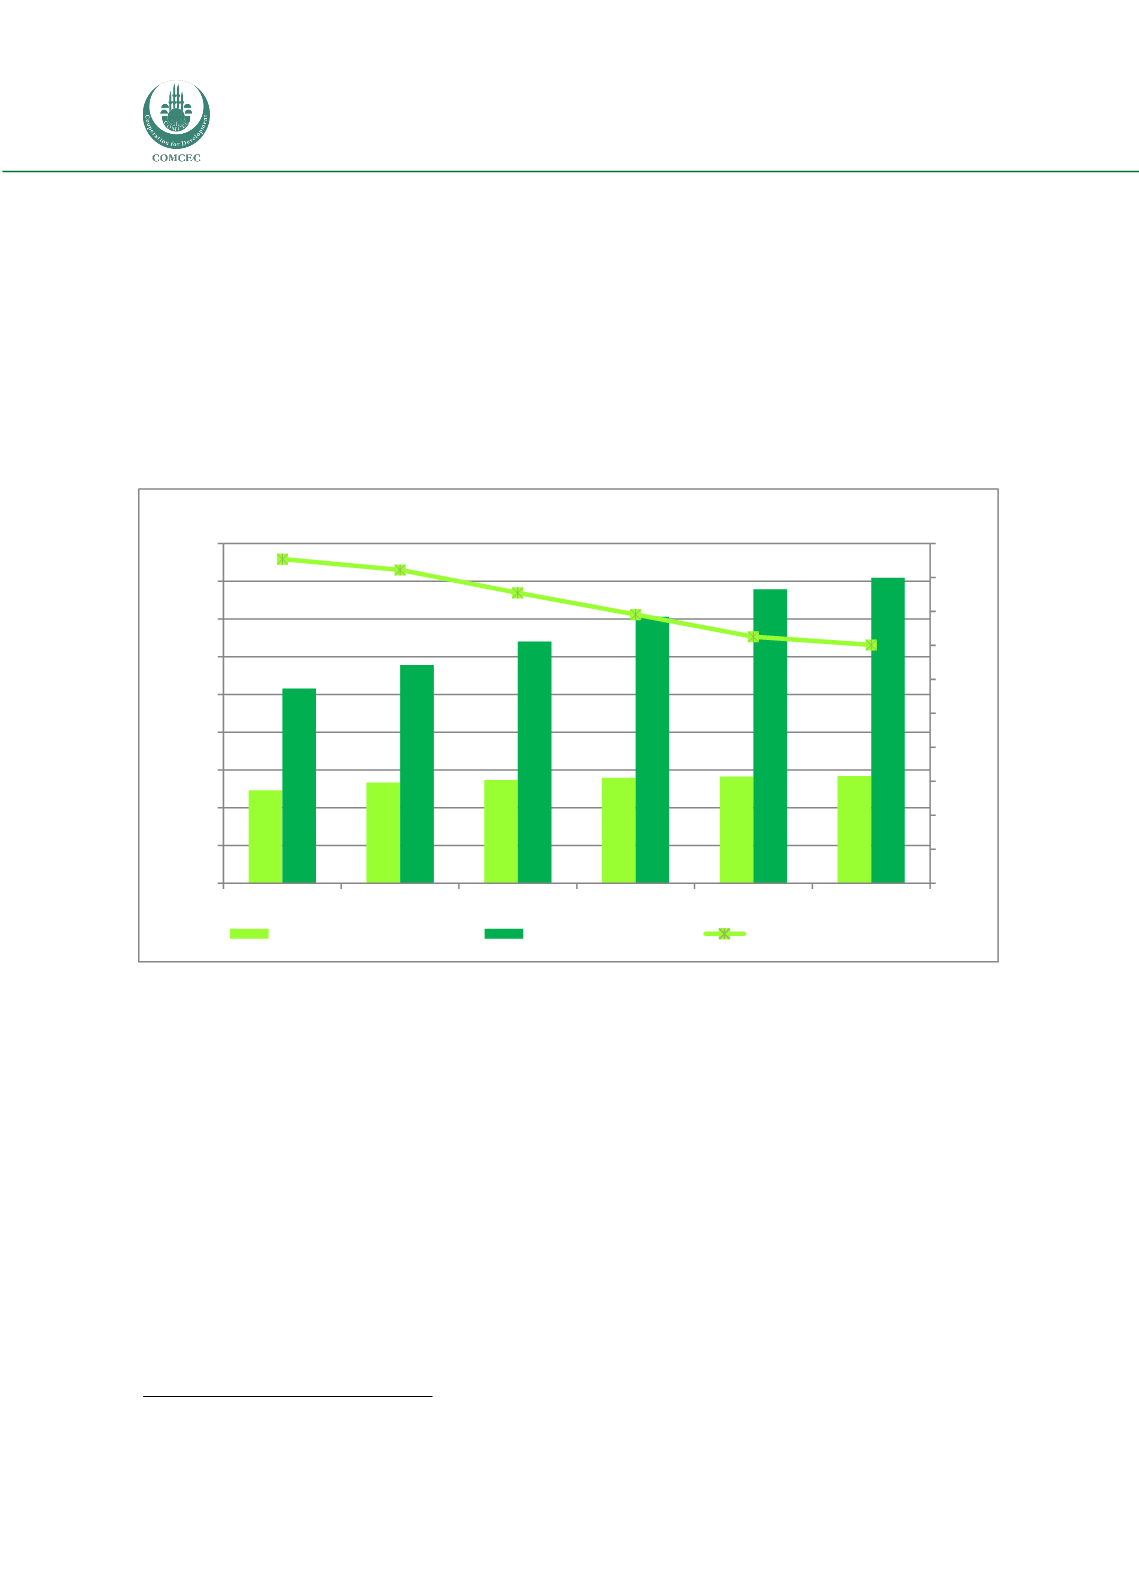
While the agricultural population of the OIC Member Countries was 492 million people
in 1990 with 47.7 percent share in total population, it increased to almost 568 million people,
constituted 35.1 percent of the total OIC population in recent years. The main reason of
decreasing the agricultural population share was that the increase in agricultural population
was lower than the increase in total population throughout the years. This reflects that
worldwide trend of urbanization is also observable for the OIC Member Countries, in general.
In general terms, the share of agricultural population in total population is decreasing in
the OIC as well as in all sub-regions. Within the sub-regions, the share remained higher in the
African Group with 47 percent and the lowest level was Arab Group with 24.2 percent in 2012.
Figure 6. Share of Agricultural Population in the OIC
Source: Calculated by using SESRIC online database
On the other hand, at the individual country level, agricultural population represented
more than 50 percent of the total population in 16 OIC Member Countries. For instance, as of
2012, the share of people dealing with agriculture was over 75 percent in some OIC Countries
such as Burkina Faso, Niger, Guinea, Guinea-Bissau, Gambia and Mozambique. As the majority
of their population depending on agriculture for their livelihood, agriculture sector has a vital
importance for the OIC Member Countries in African Group.
5
1.4.
Employment
As many of the developing countries, agriculture is one of the prominent sectors which
employs significant amount of workers in the OIC. The number of people employed in the
agriculture sector in the OIC Member Countries reached to 240 million in 2013, which
accounts for the 18 percent of world’s agricultural employment. These numbers clearly show
5
SESRIC, 2014
47,7
46,1
42,8
39,6
36,3
35,1
0
5
10
15
20
25
30
35
40
45
50
0
200
400
600
800
1.000
1.200
1.400
1.600
1.800
1990
1995
2000
2005
2010
2012
Percent
Million People
Total OIC Agr. Population
Total OIC Population
Share of Agr. Population