


 56 / 107

45
COMCEC Agriculture Outlook 2019
Table 11 Cluster groups for Adaptive Capacity Index (ACI) scores
Cluster 1
Cluster 2
Low AC
Moderate AC
High AC
Very High AC
(0-0,27)
(0,28- 0,59)
(0,60-0,78)
(0,79-1,00)
Ethiopia
, Togo,
Mali,
Mozambique
,
Tanzania,
Madagascar,
Kenya,
Nigeria,
Mauritania,
Cambodia,
Uganda
,
Afghanistan, Cote
d’Ivoire,
Malawi,
Cameroon
(9)
Rwanda, Ghana,
Zambia, Congo Rep.,
Laos,
Senegal
,
Lesotho, Nepal,
Swaziland, Namibia,
Mongolia, Nicaragua,
India,
Bangladesh
,
Bolivia,
Pakistan
,
Botswana,
Tajikistan
, Fiji,
Honduras,
Indonesia,
Guatemala
(5)
Paraguay, Philippines, S.
Africa,
Morocco
, El Salvador,
Moldova,
Kyrgyz Rep.
, Peru,
Algeria, Vietnam,
Uzbekistan
, Armenia,
Albania
, Dominican Rep.,
Belarus, Sri Lanka, Jamaica,
Venezuela, Russia, Ukraine,
Panama,
Egypt, Tunisia,
Kazakhstan
, Colombia,
Thailand,
Iran
, China,
Ecuador, Brazil, Romania,
Bosnia and Herzegovina,
Macedonia, Argentina,
Bulgaria,
Suriname
(9)
Turkey
, Latvia, Mexico,
Lithuania,
Malaysia
, Uruguay,
Trinidad Tobago, Cuba,
Lebanon, Poland, Estonia,
Hungary,Mauritius, Croatia,
Saudi Arabia, Jordan
,
Slovakia, Costa Rica, Czech
Rep., Georgia, Slovenia,
Kuwait
, Finland, Malta, UK,
Greece, Cyprus, Spain,
Portugal, Belgium, Australia,
UAE
, Italy, Chile, Canada,
Austria, Sweden, France,
Germany, Denmark, Norway,
USA, Netherlands,
Switzerland, Japan
(6)
*OIC Member States are highlighted
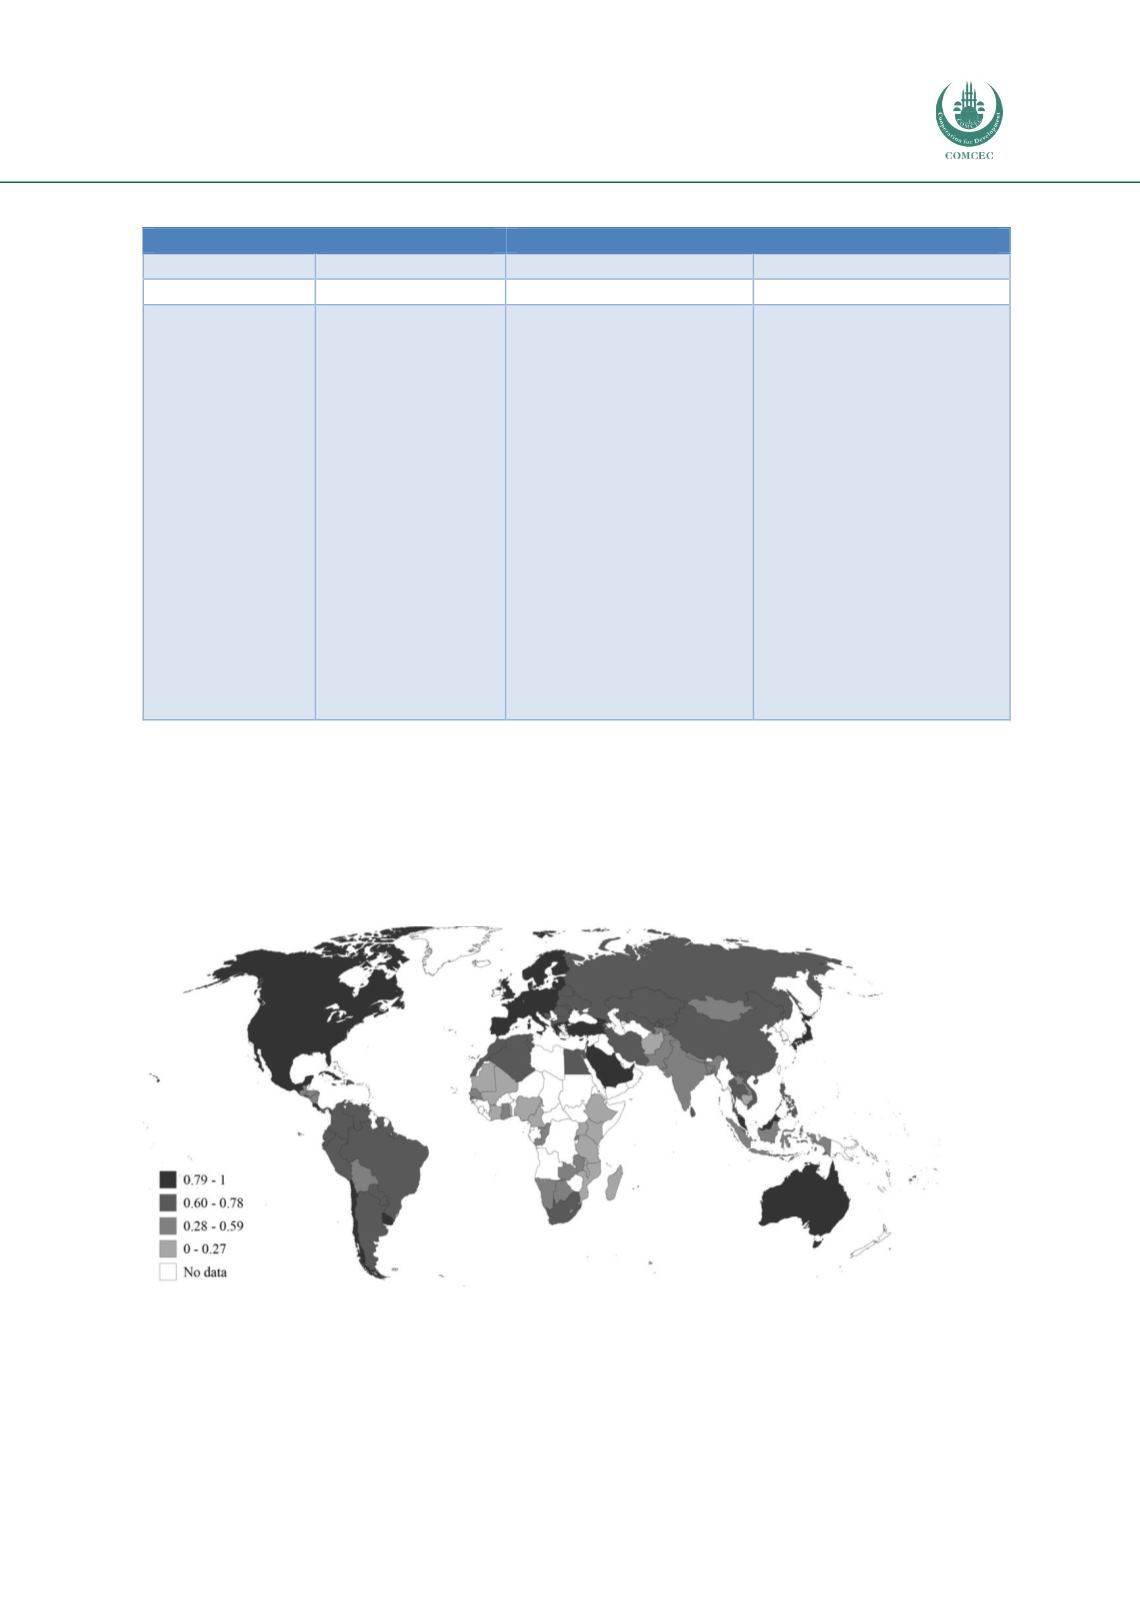
Adaptive capacity levels of 118 countries grouped into 4 as low (0-0.27), moderate (0.28-0.59),
high (0.60-0.78), and very high (0.79-1) based on the results of cluster analysis. Countrieswith
no data were shown in white.
Figure 42 Adaptive Capacity Index (ACI) shown on the world map