


 22 / 107

11
COMCEC Agriculture Outlook 2019
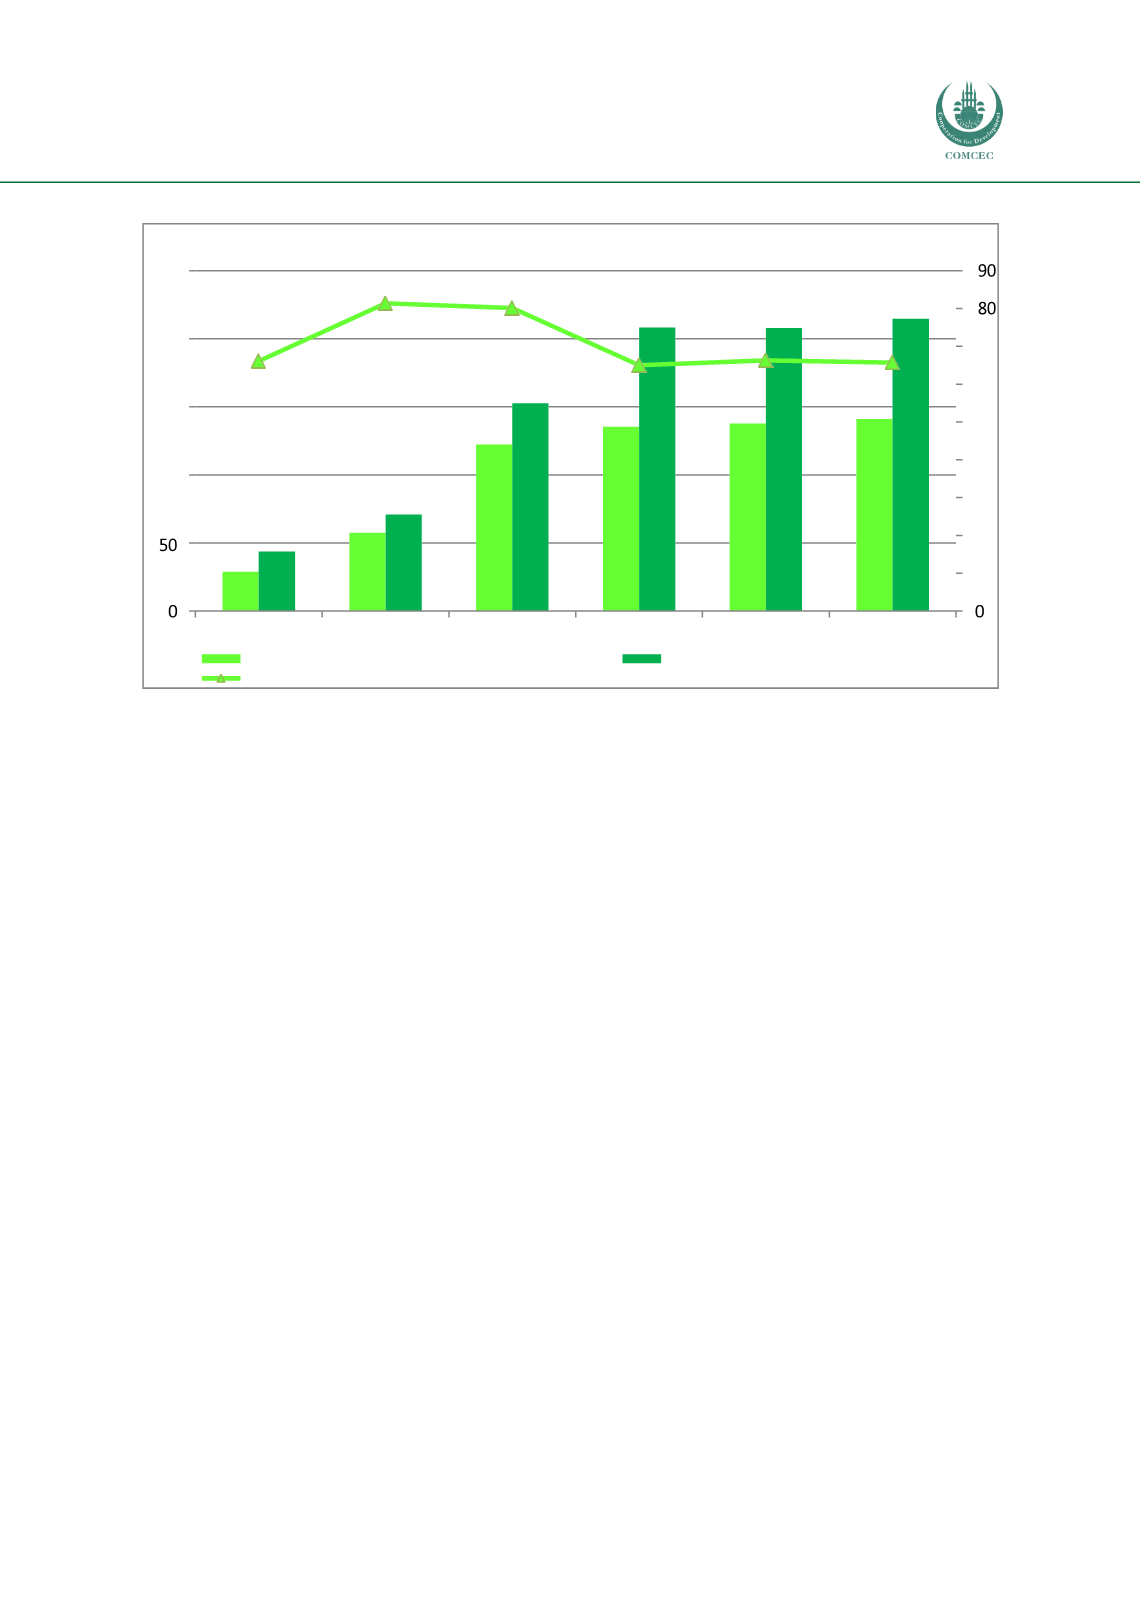
Figure 8 Agricultural Exports and Imports in the OIC
Source: Annex 12 and 13
The export/import ratio which is a useful indicator for assessing trade performance is also
shown in Figure 8. While the ratio of exports to imports was around 66 percent in 2001, it
increased to almost 82 percent in 2010. Nonetheless, the export/import ratio has shown a
declining path around 65 percent in recent years. The poor performance of agricultural exports
in 2017 negatively affected the export/import ratio, regressing it to almost back to 2015 level,
65 percent.
Figure 9 illustrates OIC’s agricultural trade performance in theworld. The share of OICmember
countries’ agricultural imports in the world increased to 12.80 percent in 2017 from 8.17
percent in 2001. Correspondingly, the contribution of OIC agricultural exports to world total
agricultural export reached 8.60 percent. Both agricultural imports and exports have
significantly risen in the period of 2001-2010. During the 2010-2017 period, while the share of
agricultural commodity exports of the OICMember Countries stabilized, the contribution of OIC
agricultural imports to total world agricultural imports started to decline.
Most of the OIC member countries have trade deficits in agriculture. As of 2017, 74 billion US
Dollars trade deficit occurred in the OIC. Figure 10 also illustrates the agricultural tradebalance
in the OIC Sub-Regions in 2017. The only groupwhich had a positive trade balance was theAsian
Groupwith 5.8 billion US Dollars. On the other hand, African and Arab Groups have registered
trade deficits of 2.1 and 77.4 billion US Dollars, respectively.
Billion Dollar
250
81.4
80.1
%
200
66.0
65.0
66.2
65.7
150
70
60
50
100
40
30
20
10
2001
2005
2010
2015
2016
2017
OIC Member Countries Agricultural Export
OIC Member Countries Agricultural Import
Ratio of Export toImport