


 50 / 103

COMCEC Agriculture Outlook 2018
39
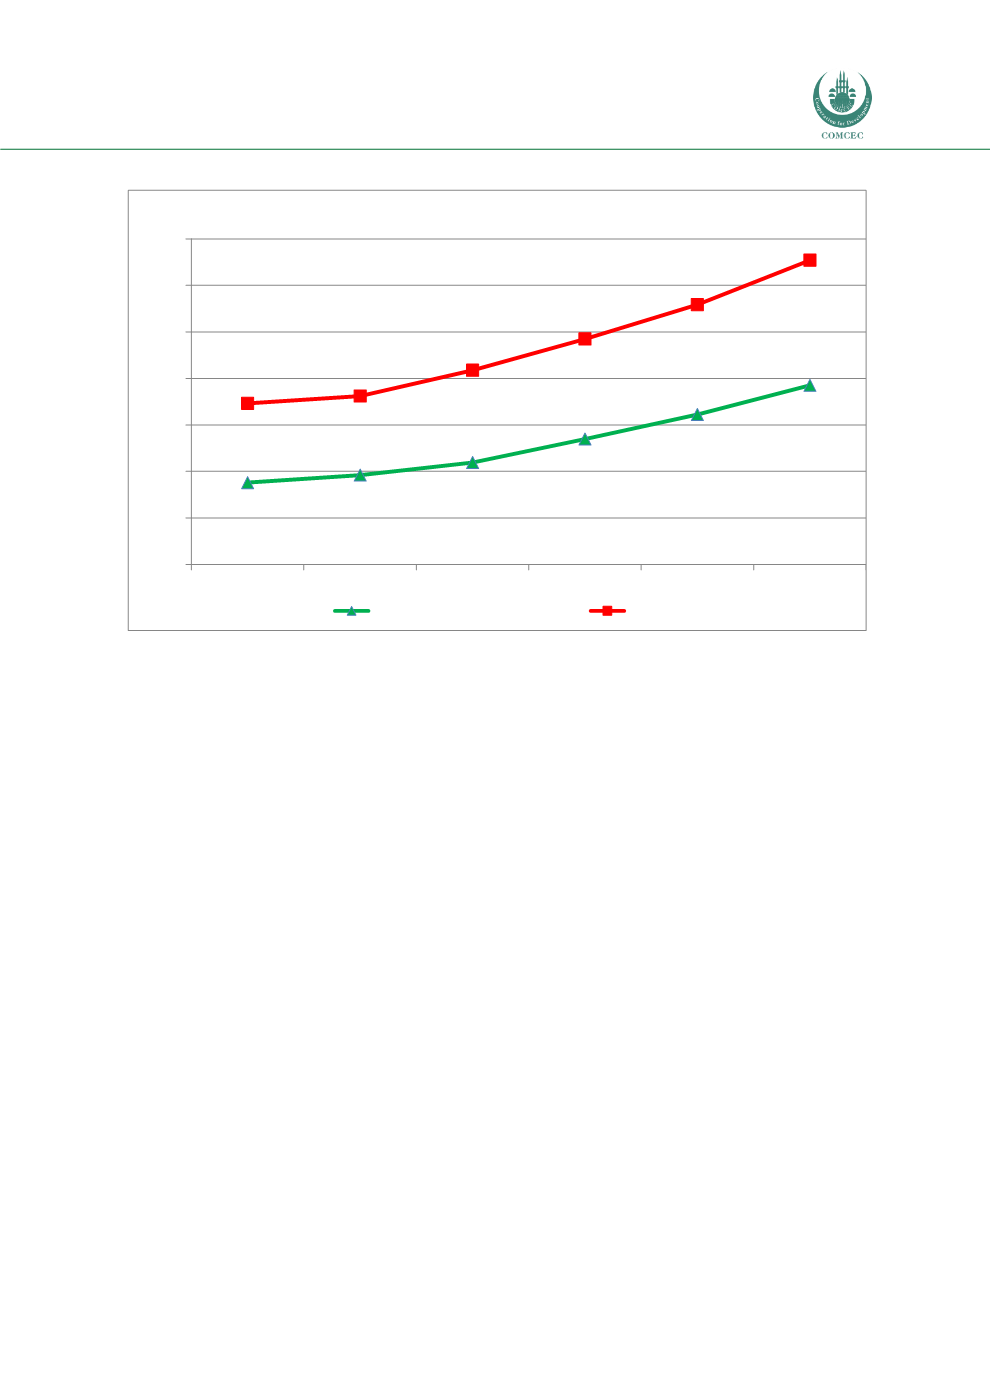
Figure 33. GDP Per Capita in the OIC and World
Source: Annex 39
GDP Per Capita
: Figure 33 demonstrates the developments in GDP per capita valued at constant
2011 International Dollars using purchasing power parity rates in the OIC and World and by
using a weighted population averages. Therefore, this indicator provides information on the
possibility of economical access to markets taking into account the purchasing power of regions.
As it is seen in the figure, average GDP per capita of the OIC member countries reached 9,704
Int. Dollars, while it was 5,400 Int. Dollars in 1990s. Compared to the world, average GDP per
capita of the OIC member countries was far away from the world average, which was almost
15,080 Int. Dollars in 2016. Nonetheless, 75 percent growth in the GDP per capita of the OIC
member countries in the period 1990-2016 was higher than the World’s average of 68 percent.
At the sub-regional level, average GDP per capita of Arab Group was the highest with 14,928 Int.
Dollars in 2016. It was followed by Asian Group and African Group with 10,248 and 3,512 Int.
Dollars, respectively.
5.521
5.842
6.381
7.390
8.446
9.704
8.926
9.242
10.346
11.698
13.176
15.080
2000
4000
6000
8000
10000
12000
14000
16000
1990
1995
2000
2005
2010
2016
Dollar
OIC
World