


 54 / 103

COMCEC Agriculture Outlook 2018
43
Annex 37 illustrates the domestic food price volatility index that corresponds to the variability
of the "food supply in kcal/caput/day" in the OIC member countries and world. The variability
index series is calculated by fitting a cubic spline trend by ordinary least squares to the series.
The difference between the cubic fit and the actual values are then computed and then the index
for a specific year is defined as the standard deviation of these differences over the previous five
years. OIC level food supply variability has a similar trend with respect to World average but
OIC level variations seem to be 2 times higher than World level.
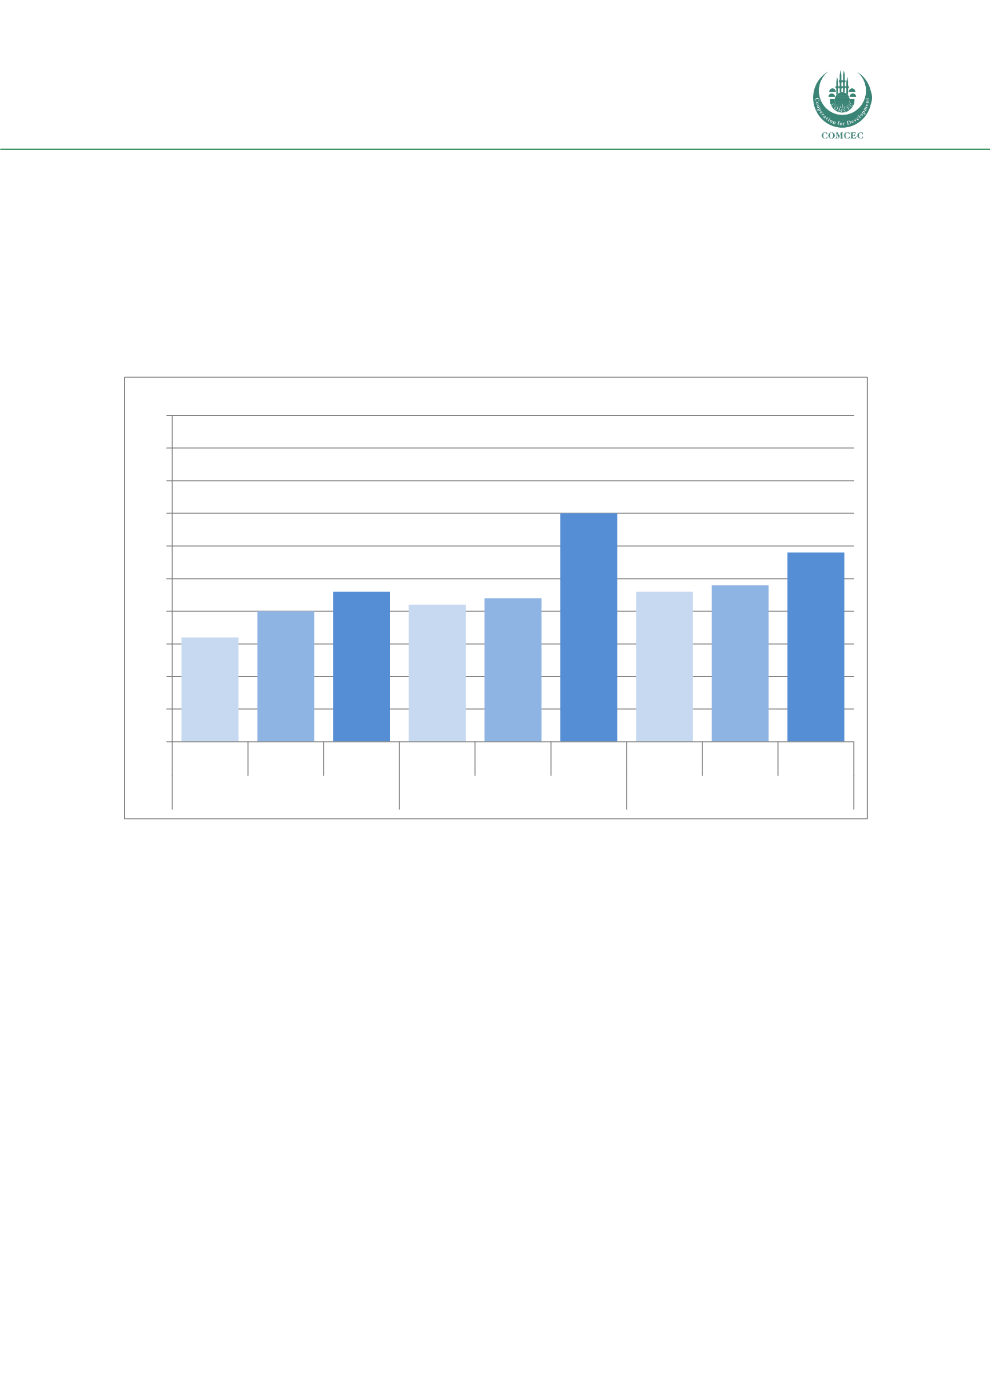
Figure 38: Per Capita Food Supply Variability in the OIC by Sub-Regions, kcal/caput/day
Source: Annex 41
At the sub-regional level, there appears to be a serious problem for each Groups but it is most
acute for Arab Group. In 2013, the food supply variability has reached 75 in the Arab Group and
69 in the Asian Group with a secular increasing trend in each of the OIC regions in oppose to the
global trend of decrease in food supply variability.
56
60
63
61
62
75
63
64
69
40
45
50
55
60
65
70
75
80
85
90
2000 2005 2013 2000 2005 2013 2000 2005 2013
African Group
Arab Group
Asian Group
kcal/caput/day