


 52 / 103

COMCEC Agriculture Outlook 2018
41
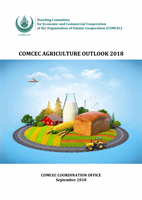
Figure 35. Access to Improved Water Sources in the OIC and the World
Source: Annex 40
Figure 35 illustrates the percentage of population having access to improved drinking water
sources in the OIC and the World. As of 2015, 80 percent of OIC population has access to
improved drinking water sources compared to 71 percent in 1990. Access to improved water
sources in the OIC has been lower than the world average over the years
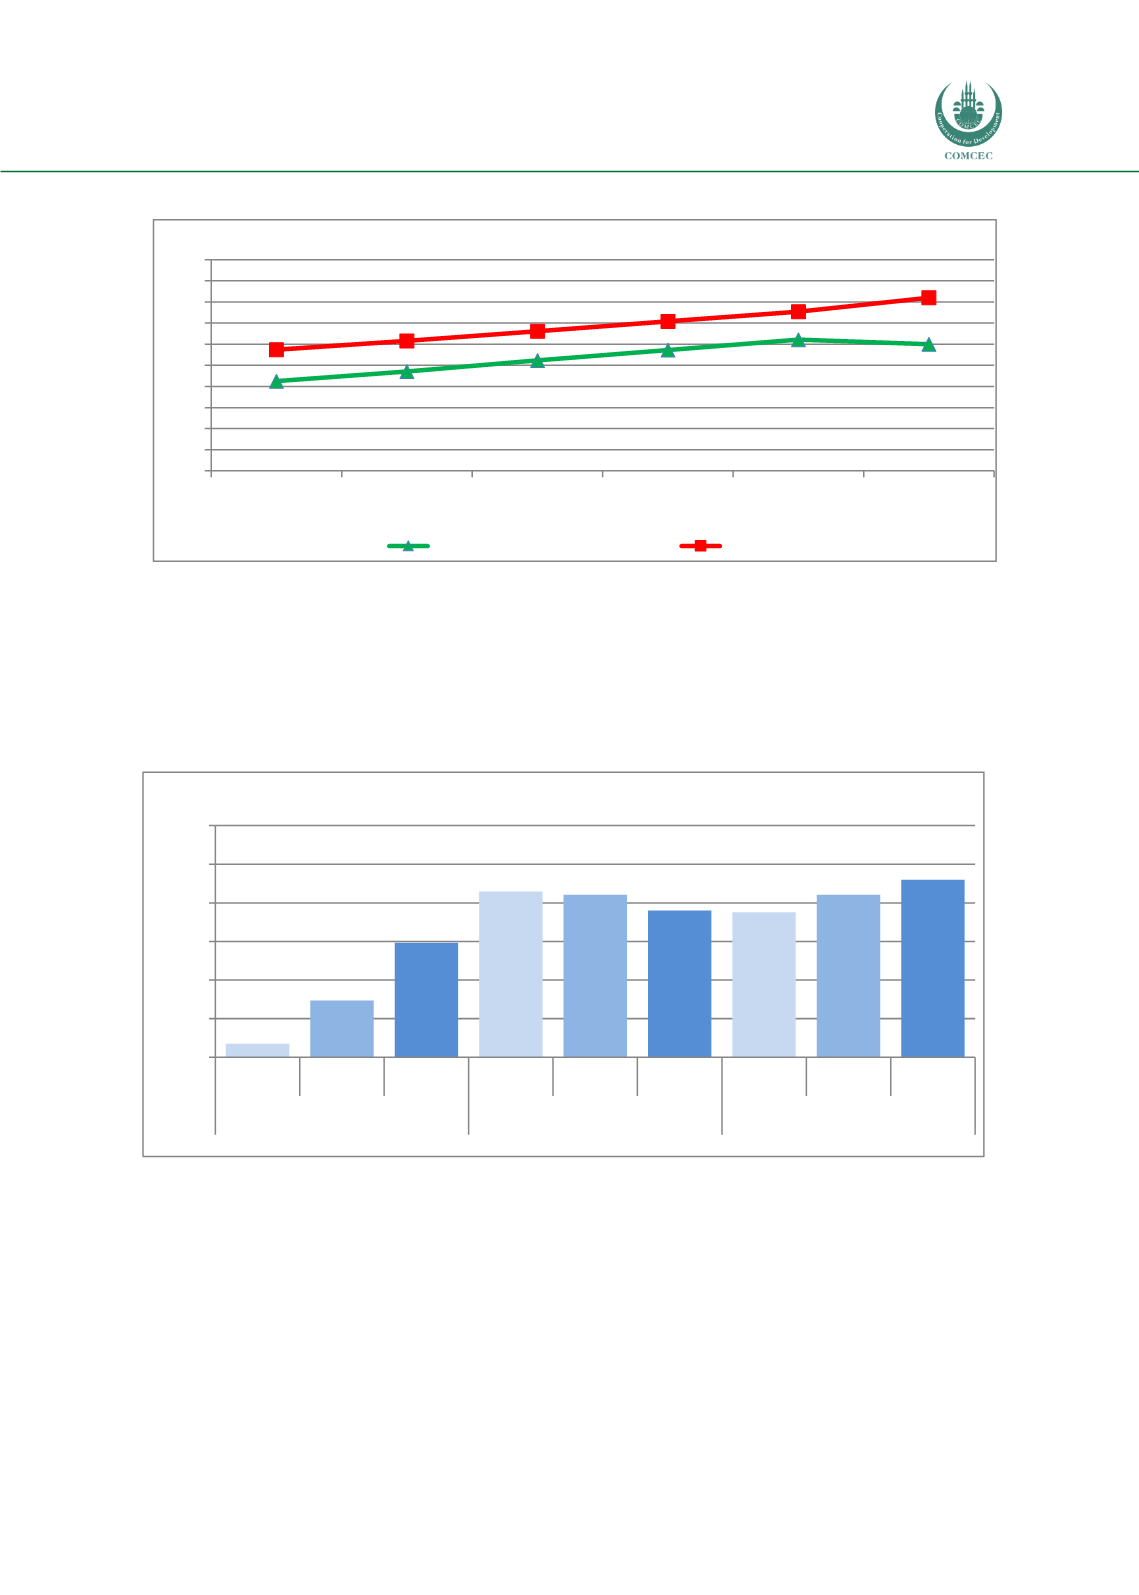
Figure 36. Access to Improved Water Sources in the OIC by Sub-Regions
Source: Annex 40
At the sub-regional level, there does not appear to be a serious problem in Asian and Arab
Groups with respect to access to improved water sources. In 2015, the percentage of population
having access to improved drinking water sources has reached 86 percent in the Asian Group
and 78 percent in the Arab Group, both of which were slightly lower than the World average.
However, access to improved water sources in the African Group is still a big concern. Even
though great extent of progress has been achieved from the 1990s to the present, the percentage
of population having access to improved drinking water sources in the African Group was
recorded as 70 percent in 2015.
71
74
76
79
81
80
79
81
83
85
88
91
50
55
60
65
70
75
80
85
90
95
100
1990
1995
2000
2005
2010
2015
Percentage
OIC
World
43
55
70
83
82
78
78
82
86
40
50
60
70
80
90
100
1990 2000 2015 1990 2000 2015 1990 2000 2015
African Group
Arab Group
Asian Group
Percentage