


 45 / 103

COMCEC Agriculture Outlook 2018
34
Value of Food Production:
Average value of food production, which provides a cross country
comparison of the relative economic size of the food supply in a country or region, is another
indicator to measure the availability aspects of food security. It is calculated in three year
averages, and expresses the food net production value, in constant 2004-06 international dollar
terms, per caput.
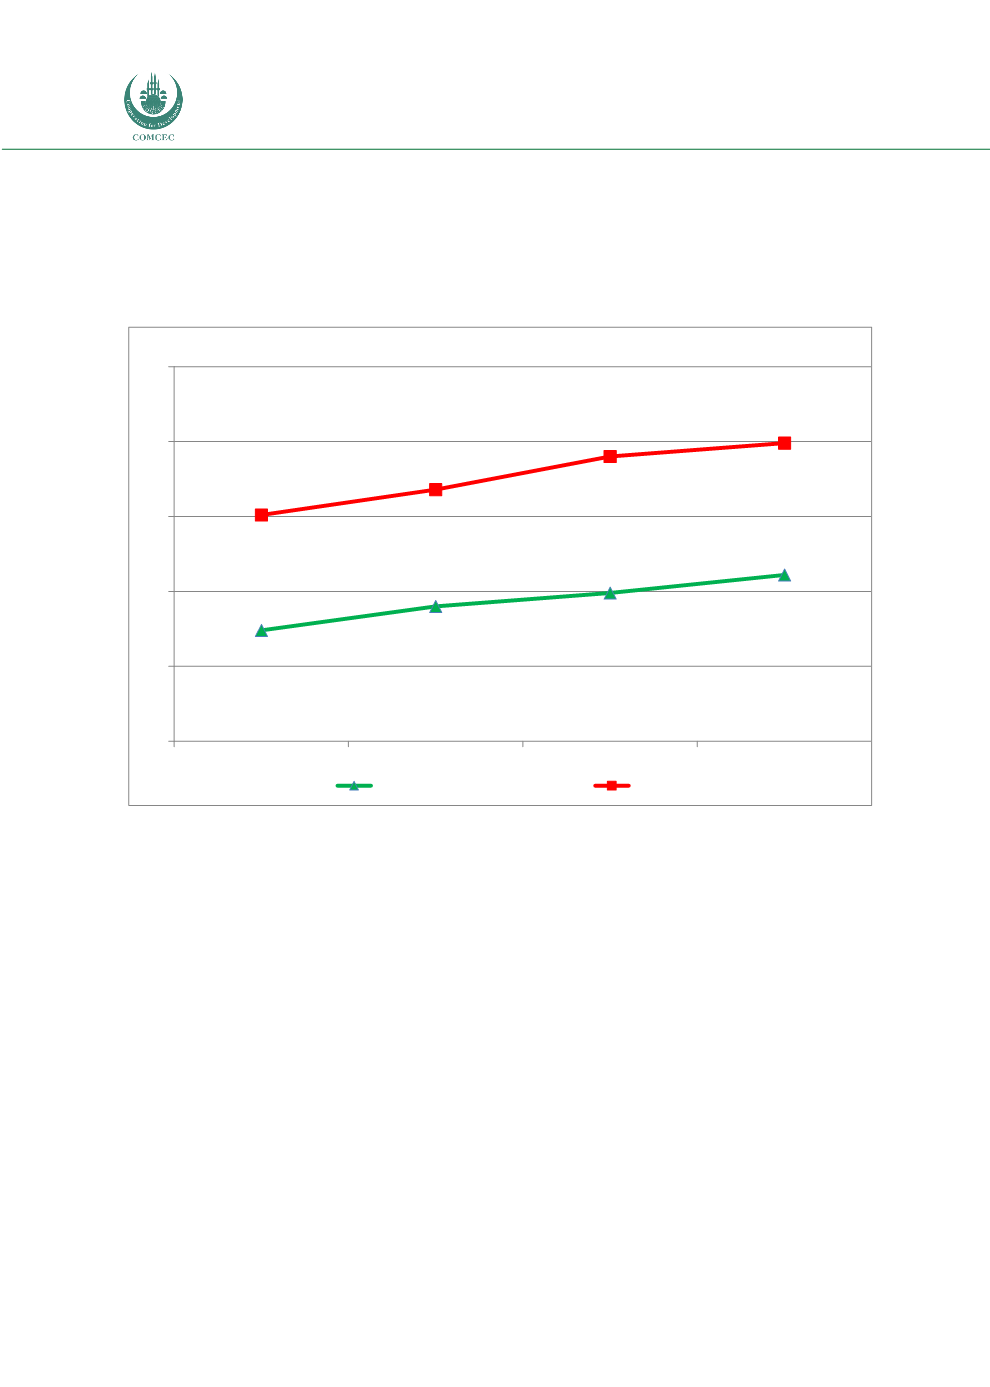
Figure 27. Average Value of Food Production in the OIC and the World
Source: Annex 36
Figure 27 shows the average value of food production from 1999-2001 to 2012-2014. As of
2012-2014, average value of food production in the OIC member countries reached 221 dollars
per capita, from 184 dollars in 1999-2001. Between these periods, it has increased by 20
percent. However, in 2012-2014, OIC average value of food production per caput was almost 30
percent lower than the world average.
At the sub-regional level, Asian Group has the highest average value of food production per caput
with 249 dollars, increasing by over 25 percent from199 dollars in 1999-2001. As of 2012-2014
period, Asian Group was followed by Arab Group and African Group with 198 and 180 dollars
per capita respectively. The growth of average value of food production in African and Arab
Groups were 28 and 3 percent respectively.
184,0
200,0
209,0
221,0
261,0
278,0
300,0
309,0
110
160
210
260
310
360
1999-2001
2004-2006
2009-2011
2012-2014
I$ per caput
OIC
World