
Financial Outlook of the OIC Member Countries 2016
5
Panel D. Aggregated Total Deposits and Short Term Funding of the Banking Sector (millions
USD)
Bankscope Data
Survey Response
Coverage Ratio
2013
2014
2015
2013
2014
2015
2013
2014
2015
Algeria
83.903
91.748
2.282
117.400
132.120
105.330
71
69
2
Egypt
168.489
200.650
193.068
189.058
217.852
247.391
89
92
78
Senegal
5.471
5.917
2.059
5.725
5.684
5.890
96
104
35
Sudan
2.923
2.663
2.960
8.321
9.283
10.844
35
29
27
Turkey
554.501
572.237
510.663
727.377
755.334
706.248
76
76
72
Note: The rate of 104 for Senegal in 2014 may raise question marks. However, this probably arises from the fact
that the definition of deposits and short term funding slightly differs between Bankscope and COMCEC country
representatives. Bankscope provides no detailed definition.
Source: Survey conducted by COMCEC Coordination Office among Financial Cooperation Working Group country
focal points.
Table 2 reveals two facts. One is that coverage ratio is fluctuating among countries but shows
good coverage for Algeria, Egypt, Senegal and Turkey. The second is that the coverage ratio
greatly decreases in 2015 and the ratios are similar for those in 2013 and 2014. This indicates
that Bankscope database should be used in caution for some countries to draw policy
recommendations and conclusions. It also reveals that although it is better to use the most
recent data, the data in 2014 should be used since the coverage in 2015 is unsatisfactory.
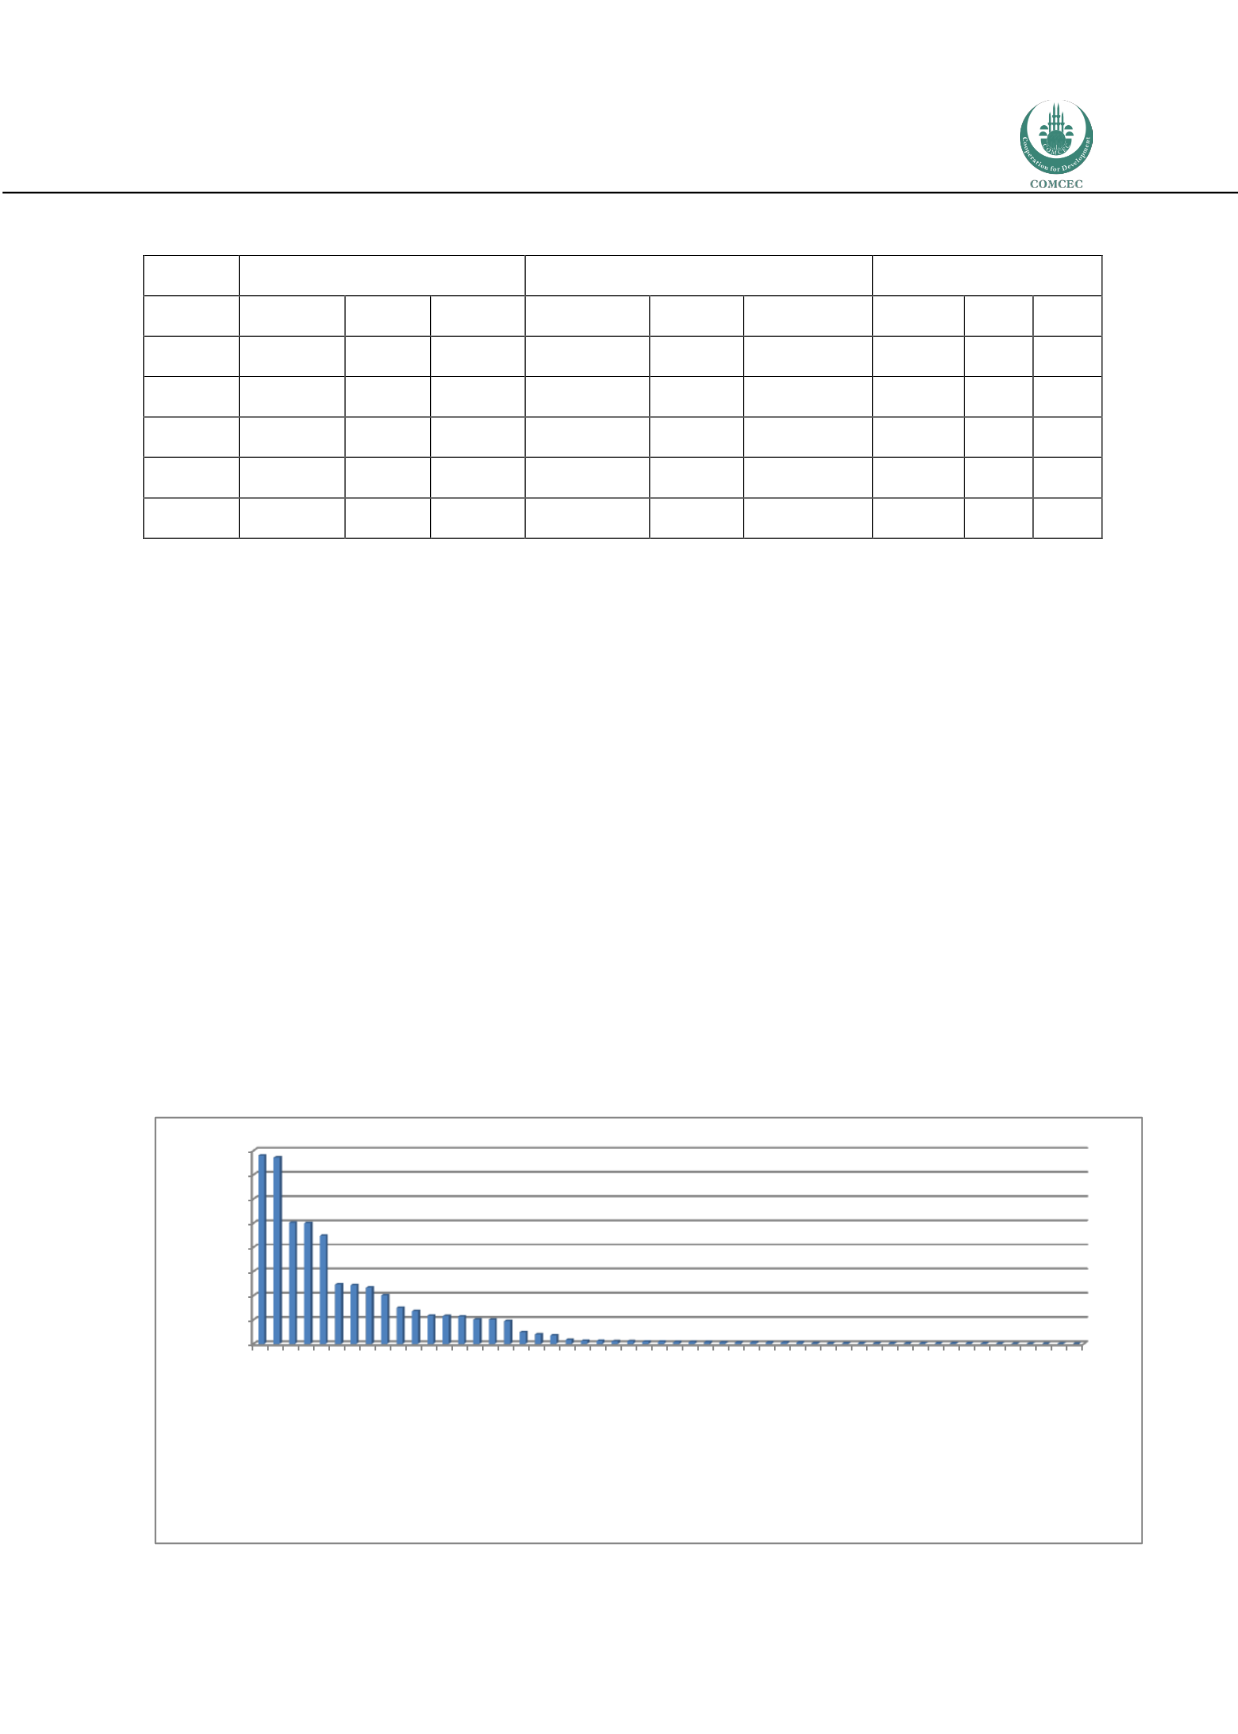
According to Bankscope database, total assets in 2014 for all OIC member countries are about
5.1 trillion USD. First 5 countries, Turkey, Malaysia, United Arab Emirates, Saudi Arabia and
Indonesia, comprise of about 3 trillion USD of the total assets. First 10 countries, Islamic
Republic of Iran, Qatar, Egypt, Kuwait, Nigeria in addition to top 5, comprise of about 4.1
trillion USD of total assets, about 80 percent of all assets in OIC member countries (Figure 1).
Figure 1: Total Assets in 2014 (in millions USD)
Panel A. All countries
0
100.000
200.000
300.000
400.000
500.000
600.000
700.000
800.000
TURKEY
MALAYSIA
UNITED ARAB EMIRATES
SAUDI ARABIA
INDONESIA
ISLAMIC REPUBLIC OF IRAN
QATAR
EGYPT
KUWAIT
NIGERIA
MOROCCO
PAKISTAN
ALGERIA
JORDAN
BANGLADESH
LEBANON
BAHRAIN
KAZAKHSTAN
OMAN
TUNISIA
LIBYA
IRAQ
AZERBAIJAN
MOZAMBIQUE
ALBANIA
COTE D'IVOIRE
TURKMENISTAN
SENEGAL
UZBEKISTAN
CAMEROON
UGANDA
SUDAN
SYRIAN ARAB REPUBLIC
PALESTINIAN TERRITORIES
GABON
BURKINA FASO
MALI
AFGHANISTAN
TOGO
SURINAME
BRUNEI DARUSSALAM
BENIN
NIGER
YEMEN
KYRGYZSTAN
GUYANA
MAURITANIA
MALDIVES
DJIBOUTI
GUINEA
TAJIKISTAN
SIERRA LEONE
CHAD
GAMBIA


