
Malnutrition in the OIC Member
Countries: A Trap for Poverty
COMCEC
Stunting
Wasting Overweight
Anaemia
Survey
2014 DHS 2014 DHS
2014 DHS 2011 DHS
Region: Dhaka
33.9
11.9
2. 1
47.7
Region: Khulna
28.1
13.5
0.4
54.2
Region: Rajshahi/Rangpur
33.5
17.5
1.1
53.3
Region: Rangpur
36
17.7
1.3
57.7
Region: Rajshahi
31.1
17.3
0.9
49.3
Mean
36.1
14.3
1.4
51.3
Source: Authors' calculations based on BDHS (2011,2014).
Trends in Malnutrition
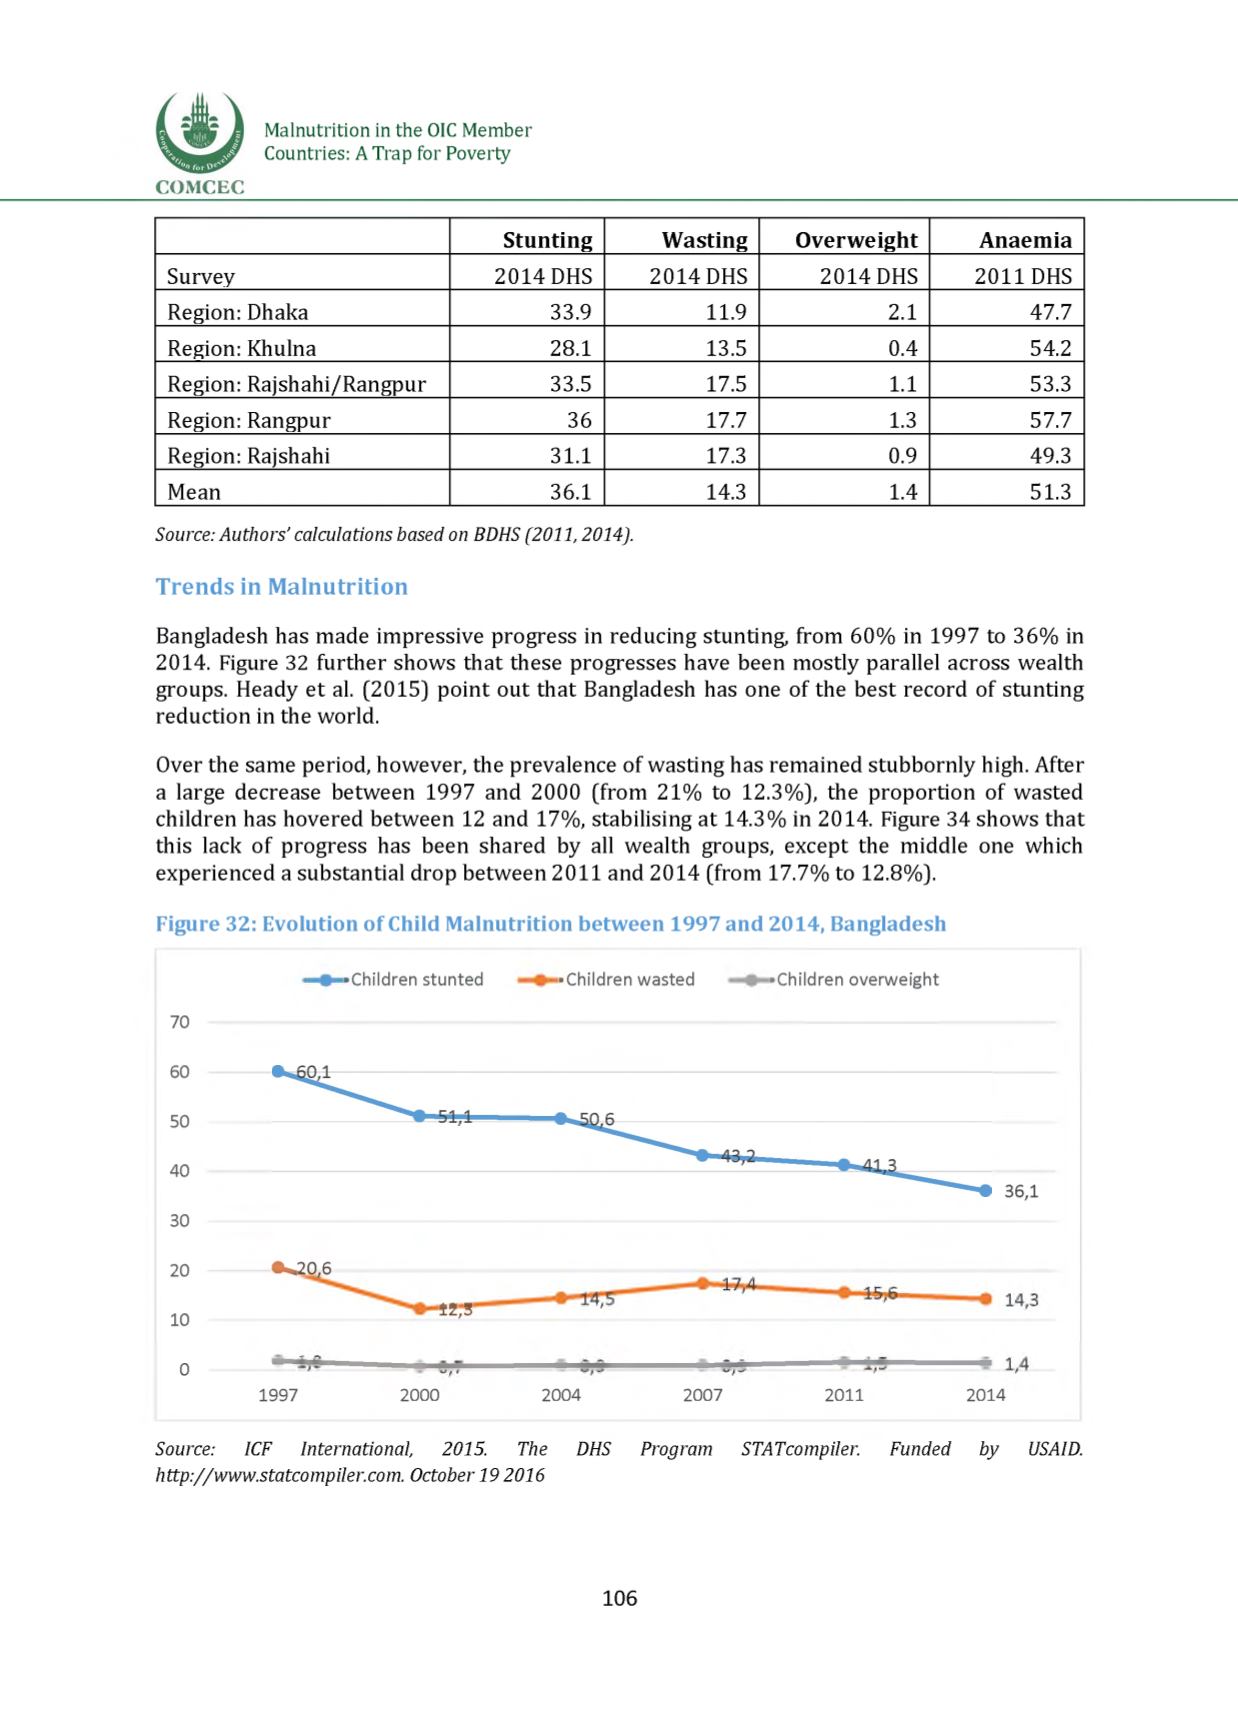
Bangladesh has made impressive progress in reducing stunting, from 60% in 1997 to 36% in
2014.
Figure 32 further shows that these progresses have been mostly parallel across wealth
groups. Heady et al. (2015] point out that Bangladesh has one of the best record of stunting
reduction in the world.
Over the same period, however, the prevalence of wasting has remained stubbornly high. After
a large decrease between 1997 and 2000 (from 21% to 12.3%), the proportion of wasted
children has hovered between 12 and 17%, stabilising at 14.3% in 2014.
Figure 34 shows that
this lack of progress has been shared by all wealth groups, except the middle one which
experienced a substantial drop between 2011 and 2014 (from 17.7% to 12.8%).
Figure 32: Evolution of Child Malnutrition between 1997 and 2014, Bangladesh
■Children stunted
■Children wasted
■Children overweight
70
60
50
40
30
36,1
20 — •>..20,6
10
12,3
0
1997
2000
2004
2007
2011
2014
Source:
ICF International,
2015.
The
DHS
Program
STATcompiler.
Funded by
USAID.
http://www.statcompiler.com.October 19 2016
106


