
Malnutrition in the OIC Member
Countries: A Trap for Poverty
COMCEC
(
1
)
(
2
)
(3)
Wasting
Stunting
Overweight
Higher education
0.84
0.64**
1 . 86
(0.15]
(
0
.
1 2
]
(
1
.
2 2
]
Breastfed immediately
1.07
1.16*
1.58
(0.16]
(0.09]
(0.48]
Exclusive breastfeeding
1.09
0.93
1 .21
(
0
.
1 2
]
(
0
.
1 0
]
(0.50]
Prenatal doctor visit
0
7 7
***
0.76***
1.63
(0.07]
(0.06]
(0.57]
Baby postnatal check after 2 months
1. 01
1.07
0.80
(0.08]
(0.09]
(0.15]
Vitamin A dose within 2 months of
0.89**
0.92*
0.80
delivery
(0.05]
(0.05]
(0.15]
Dietary diversity index
1.05***
1
1 0
***
0.99
(
0
.
0 2
]
(
0
.
0 2
]
(0.06]
Observations
3638
3638
3638
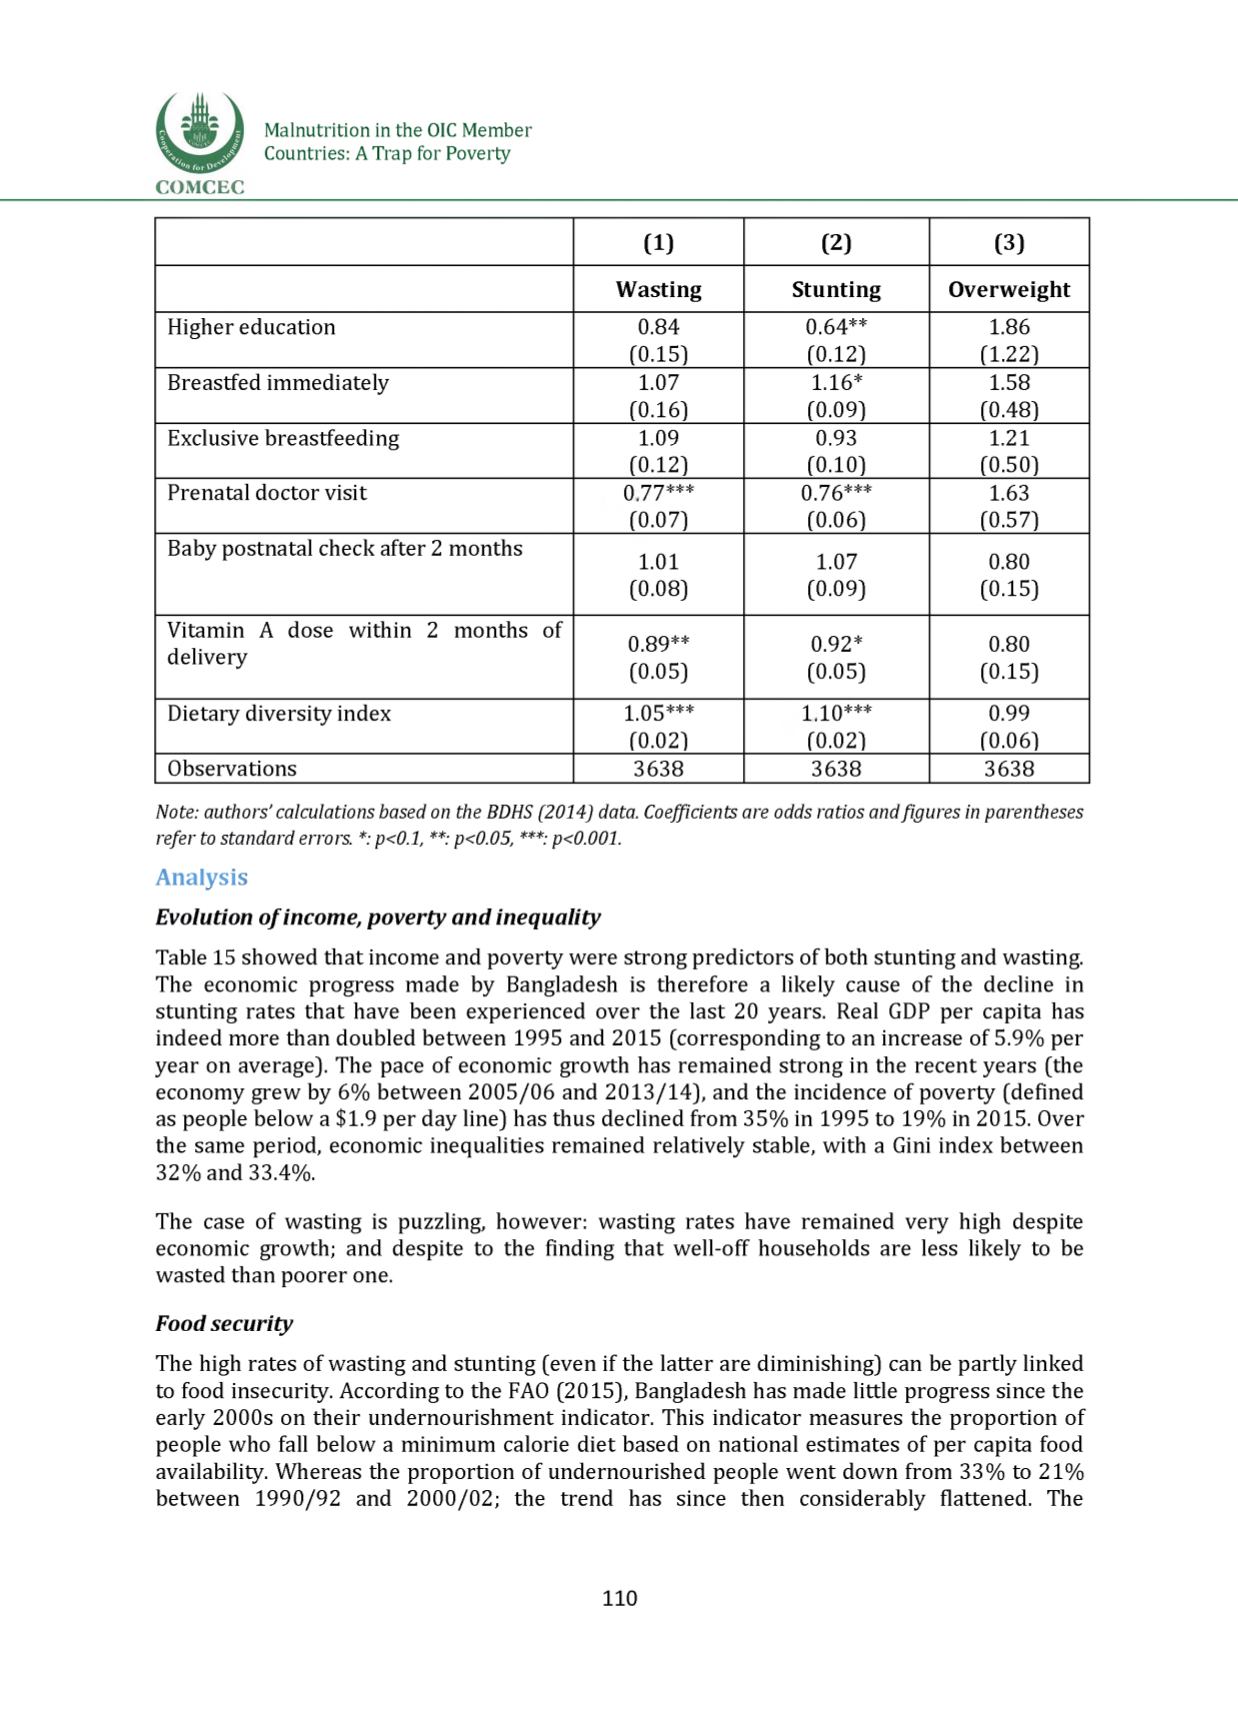
Note: authors' calculations based on the BDHS (2014) data. Coefficients are odds ratios andfigures in parentheses
refer to standard errors. *: p<0.1, **: p<0.05, ***: p<0.001.
Analysis
Evolution of income, poverty and inequality
Table 15 showed that income and poverty were strong predictors of both stunting and wasting.
The economic progress made by Bangladesh is therefore a likely cause of the decline in
stunting rates that have been experienced over the last 20 years. Real GDP per capita has
indeed more than doubled between 1995 and 2015 (corresponding to an increase of 5.9% per
year on average]. The pace of economic growth has remained strong in the recent years (the
economy grew by
6
% between 2005/06 and 2013/14], and the incidence of poverty (defined
as people below a $1.9 per day line] has thus declined from 35% in 1995 to 19% in 2015. Over
the same period, economic inequalities remained relatively stable, with a Gini index between
32% and 33.4%.
The case of wasting is puzzling, however: wasting rates have remained very high despite
economic growth; and despite to the finding that well-off households are less likely to be
wasted than poorer one.
Food security
The high rates of wasting and stunting (even if the latter are diminishing] can be partly linked
to food insecurity. According to the FAO (2015], Bangladesh has made little progress since the
early 2000s on their undernourishment indicator. This indicator measures the proportion of
people who fall below a minimum calorie diet based on national estimates of per capita food
availability. Whereas the proportion of undernourished people went down from 33% to 21%
between 1990/92 and 2000/02; the trend has since then considerably flattened. The
110


