
Malnutrition in the OIC Member
Countries: A Trap for Poverty
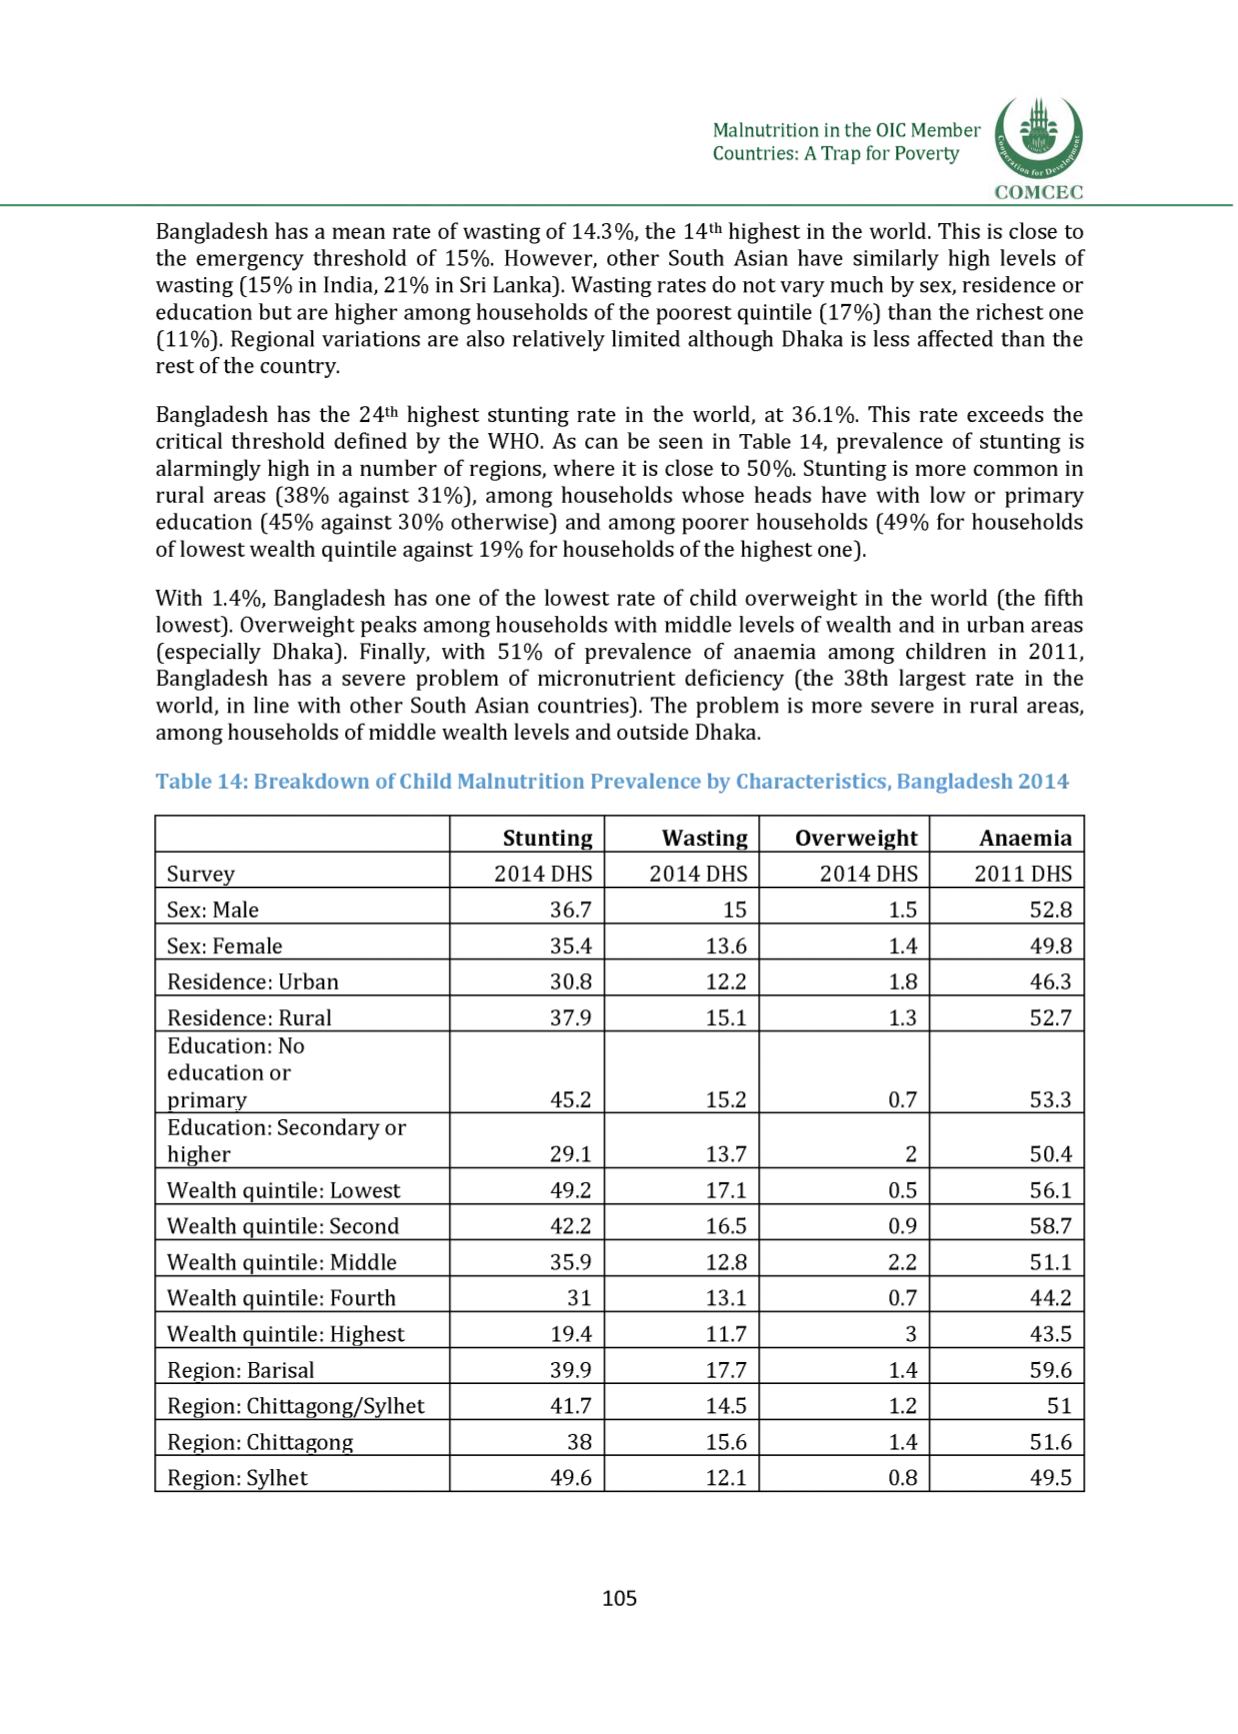
Bangladesh has a mean rate of wasting of 14.3%, the 14thhighest in the world. This is close to
the emergency threshold of 15%. However, other South Asian have similarly high levels of
wasting (15% in India, 21% in Sri Lanka). Wasting rates do not vary much by sex, residence or
education but are higher among households of the poorest quintile (17%) than the richest one
(11%). Regional variations are also relatively limited although Dhaka is less affected than the
rest of the country.
Bangladesh has the 24th highest stunting rate in the world, at 36.1%. This rate exceeds the
critical threshold defined by the WHO. As can be seen i
n Table 14, prevalence of stunting is
alarmingly high in a number of regions, where it is close to 50%. Stunting is more common in
rural areas (38% against 31%), among households whose heads have with low or primary
education (45% against 30% otherwise) and among poorer households (49% for households
of lowest wealth quintile against 19% for households of the highest one).
With 1.4%, Bangladesh has one of the lowest rate of child overweight in the world (the fifth
lowest). Overweight peaks among households with middle levels of wealth and in urban areas
(especially Dhaka). Finally, with 51% of prevalence of anaemia among children in 2011,
Bangladesh has a severe problem of micronutrient deficiency (the 38th largest rate in the
world, in line with other South Asian countries). The problem is more severe in rural areas,
among households of middle wealth levels and outside Dhaka.
Table 14: Breakdown of ChildMalnutrition Prevalence by Characteristics, Bangladesh 2014
Stunting
Wasting Overweight
Anaemia
Survey
2014 DHS 2014 DHS
2014 DHS 2011 DHS
Sex: Male
36.7
15
1.5
52.8
Sex: Female
35.4
13.6
1.4
49.8
Residence: Urban
30.8
12. 2
1.8
46.3
Residence: Rural
37.9
15.1
1.3
52.7
Education: No
education or
primary
45.2
15.2
0.7
53.3
Education: Secondary or
higher
29.1
13.7
2
50.4
Wealth quintile: Lowest
49.2
17.1
0.5
56.1
Wealth quintile: Second
42.2
16.5
0.9
58.7
Wealth quintile: Middle
35.9
12 . 8
2.2
51.1
Wealth quintile: Fourth
31
13.1
0.7
44.2
Wealth quintile: Highest
19.4
11.7
3
43.5
Region: Barisal
39.9
17.7
1.4
59.6
Region: Chittagong/Sylhet
41.7
14.5
1.2
51
Region: Chittagong
38
15.6
1.4
51.6
Region: Sylhet
49.6
12. 1
0.8
49.5
105


