


 40 / 108

33
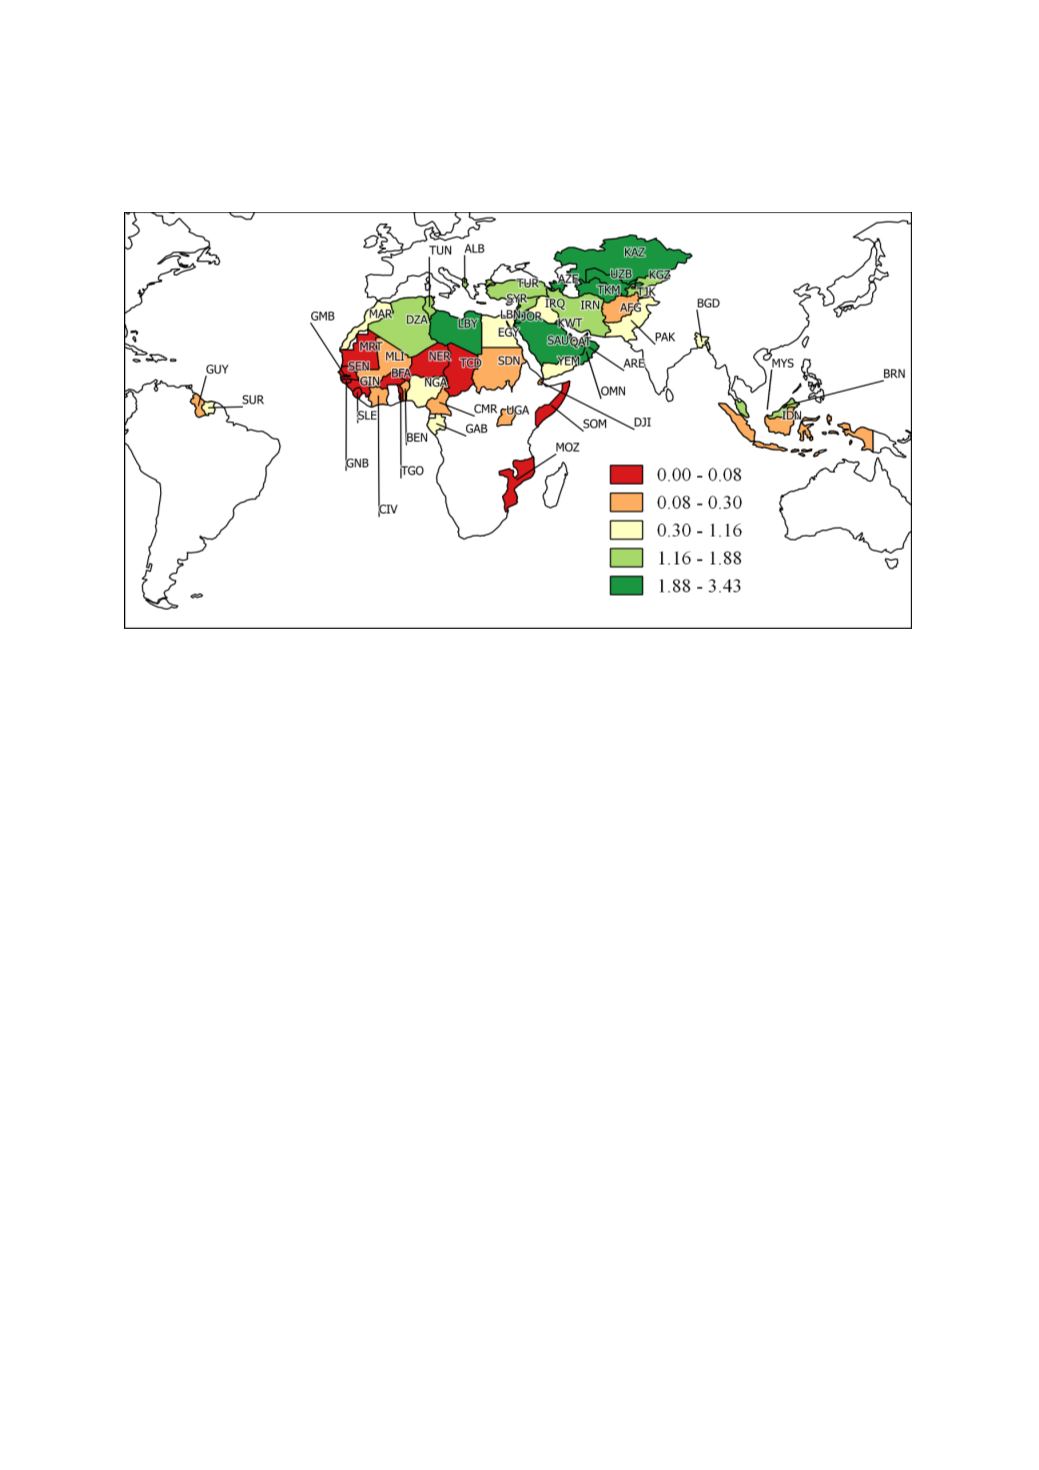
Figure 18: Physicians (per 1,000 people)
Figure 18maps the availability of physicians per 1000 people in OIC countries. The WHO estimates
that at least 2.5 medical staff (physicians, nurses and midwives) per 1,000 people are needed to
provide adequate coverage with primary care interventions (WHO, World Health Report 2006). It
must be emphasised that data comparability across countries is limited by differences in definitions
and training of medical personnel in different countries. In addition, human resources tend to be
concentrated in urban areas, so that average densities do not provide a full picture of health personnel
available to the entire population. Bearing these limitations in mind we use physicians per 1,000
people as a proxy indicator for the ease of physical access to health care. Figure 9 maps most recent
physician data for the OIC countries (the latest data in the figure are dated 2016). The high level of
variation in physician numbers among the OIC countries is brought out by the large gap that exist
between the best performer Maldives (MDV) with 3.6 physicians in 2015 (not visible at the scale in the
map) followed by Jordan (JOR) with 3.4 physicians in 2015 and Niger (NER) with 0.01 2010.
Geographic clusters is visible in
Figure 18 but perhaps not as strong for the Sub-Saharan cluster
observed i
n Figure 17in relation to hospital beds.
Table 5outlines the historical trends in hospital bed and physician data for OIC countries. Hospital
beds per 1,000 people has consistently declined in OIC countries and in the three OIC subgroups over
the 20-year period. The current level of hospital beds in OIC countries as reflected in the average for
the 2011-2015 period compares well with those for lower middle-income countries (average of 0.98
in 2011). The hospital bed statistics for OIC subgroups reported in Table 3 suggest that the fall in this
statistic over the last 20-years is the joint result of what had ensued in all three subgroups individually.
Even the best performer, Arab group, which had a figure of 1.8 in 1996-2000 had collapsed to 1.1 by
2011-2015. The intra-group averages in Table 2 further establishes that the African group is indeed
the worst performer.
The trends in physicians per 1000 people i
n Table 5sheds more light on the physical access related
challenges faced by the African OIC countries in particular but also by OIC countries as a group. Over
the two decades covered physician stats have halved for the African group and remained constant
(when considering base and periods) for the Arab group. Only the Asian group of OIC countries had
seen a consistent improvement (from 0.7 in 1996-2000 to 0.9 in 2011-2015) in this statistic.